Summary
Research compiled by Metals Focus for the Silver Institute shows the silver market moving toward a sixth year of structural deficit, with 762 million troy ounces removed from stocks since 2021. Although some liquidity has returned after the disruption last year, the report warns that conditions capable of creating another liquidity squeeze remain if volatility rises or demand patterns shift.
Overview and recent price context
Silver - used across jewellery, electronics, electric vehicles, solar installations and as an investment asset - has lost 35% of its value since a phase of intense retail buying that followed a 147% surge in 2025 and pushed prices to a record high of $121.6 an ounce in January. That dramatic rally in 2025 was built on sustained inflows to U.S. inventories and silver-backed exchange-traded products (ETPs), together with a spike in physical demand that culminated in a liquidity squeeze in the London benchmark market in October.
Since the October disruption, liquidity has improved as metal returned from the U.S., ETPs experienced outflows and demand from India eased. Still, Metals Focus highlights that structural tightness in some market segments persists and the potential for renewed pressure remains.
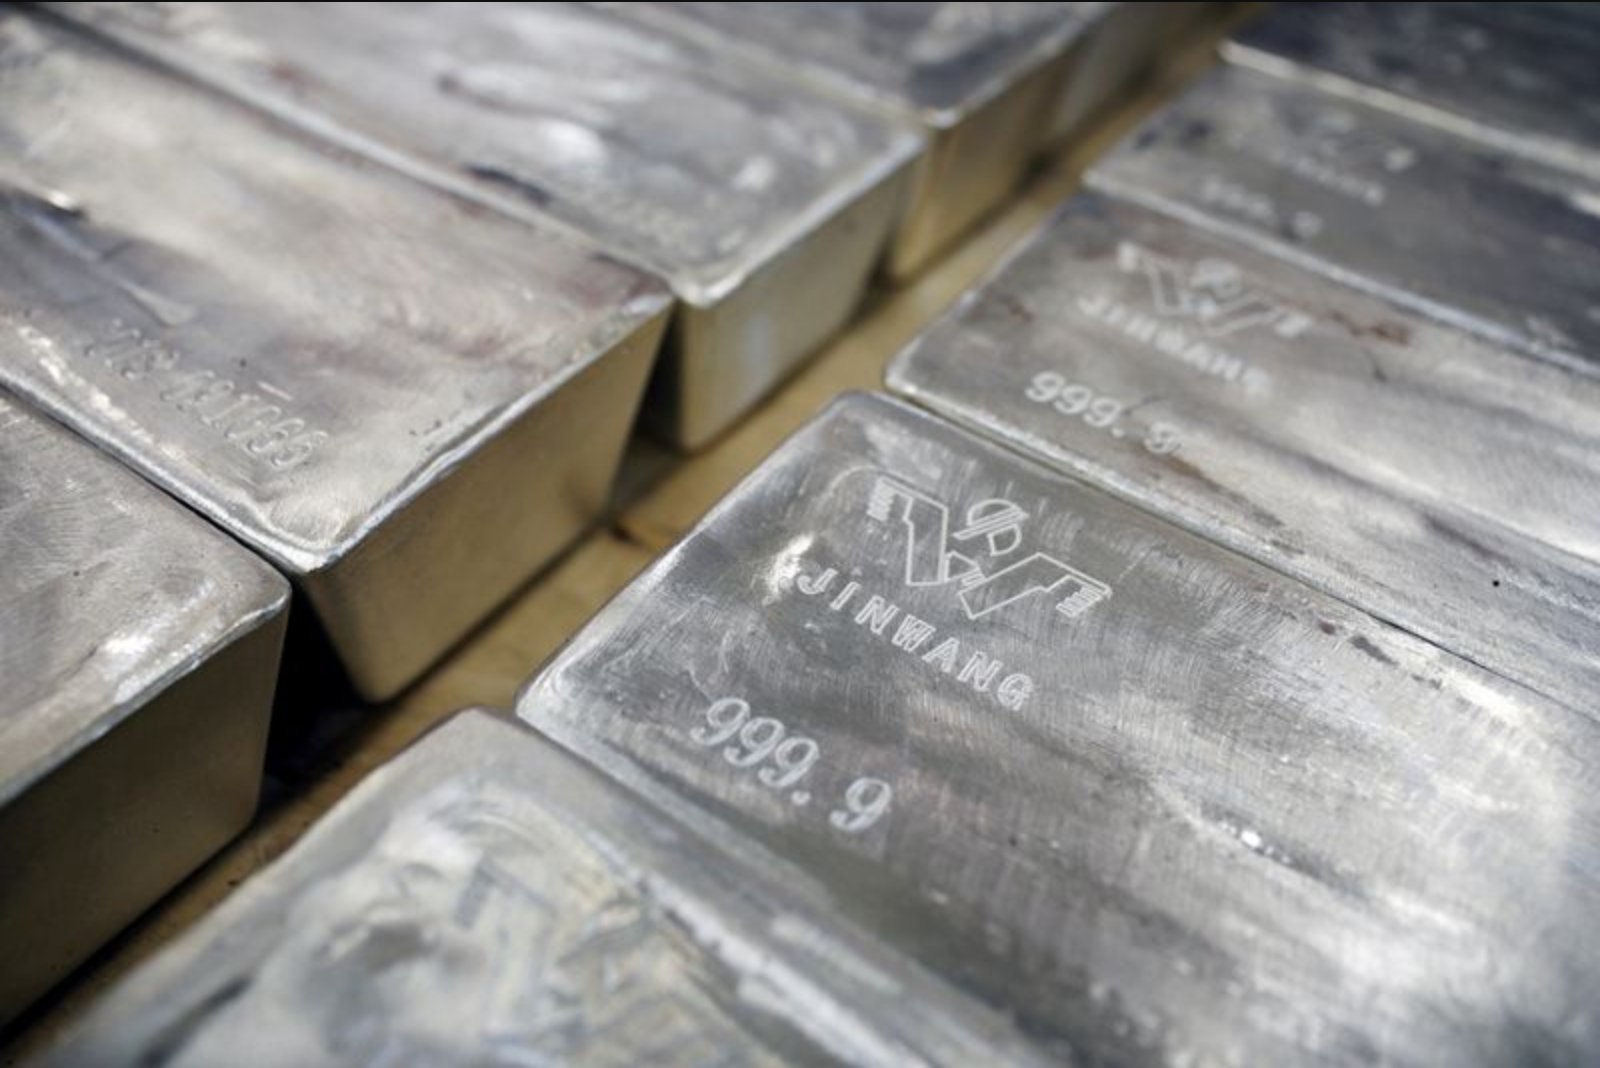
Liquidity profile in London and squeeze mechanics
Metals Focus calculates that, at end-March, 884 million ounces were held in London vaults and that 28% of that stock was not linked to ETPs and was therefore potentially available to support market liquidity. That 28% share is the largest since January 2025 and up from a low of 17% recorded in September, a low that helped precipitate the October squeeze.
"Lease rates in London have largely normalised, but risks of another liquidity squeeze this year remain," said Philip Newman, managing director at Metals Focus, which prepared the research for the Silver Institute.
Newman noted that conditions that could give rise to another squeeze would include fresh outflows from the U.S., renewed strength in Indian physical buying and renewed inflows to ETPs that store metal in London. Those factors, especially if coincident with greater price volatility, would reduce the pool of metal available to meet short-term demand.
Supply and demand outlook
The report projects the global silver market deficit to widen to 46.3 million troy ounces in 2026, up from a deficit of 40.3 million in 2025, even as total demand is forecast to fall 2%. The expected decline in demand is driven by weaker industrial fabrication and jewellery consumption, partially offset by stronger coin and bar buying.
Industrial fabrication is seen falling 3% to reach a four-year low, with the research explicitly noting that the Iran war’s damage to global growth poses additional downside risk to industrial demand. By contrast, coin and bar demand are forecast to rise 18%, supported by a recovery in U.S. purchases. Total global supply is forecast to decline 2%, a reflection of producer hedging normalising after it jumped in the second half of 2025.
Detailed supply and demand table
| 2024 | 2025 | 2026F | |
|---|---|---|---|
| SUPPLY | |||
| Mine production | 823.6 | 846.6 | 844.1 |
| Recycling | 194.5 | 197.6 | 211.3 |
| Net hedging supply | - | 44.7 | 10.0 |
| Net official sector sales | 1.5 | 1.5 | 1.0 |
| TOTAL SUPPLY | 1,019.6 | 1,090.4 | 1,066.4 |
| DEMAND | |||
| Total industrial: | 679.0 | 657.4 | 639.6 |
| - electrical/electronics | 460.9 | 449.5 | 422.9 |
| ... of which photovoltaics | 197.5 | 186.6 | 151.0 |
| - brazing alloys/solders | 49.7 | 50.5 | 51.0 |
| - other industrial | 168.4 | 157.4 | 165.7 |
| Photography | 25.5 | 24.2 | 22.5 |
| Jewellery | 205.1 | 189.3 | 159.4 |
| Silverware | 53.5 | 42.1 | 33.5 |
| Coins/net bar demand | 190.9 | 217.7 | 257.6 |
| Net hedging demand | 3.5 | - | - |
| TOTAL DEMAND | 1,157.4 | 1,130.6 | 1,112.6 |
| Market balance | -137.9 | -40.3 | -46.3 |
| Net investment in ETPs | 67.5 | 278.1 | 30.0 |
| Market Balance less ETPs | -205.4 | -318.4 | -76.3 |
Implications and closing observations
The report underscores a market that remains tight even as headline liquidity metrics have improved from the lows seen around the October squeeze. The dynamics described - large historic withdrawals from stocks, a higher share of London-held metal available to conventional liquidity channels than during the squeeze, but persistent sensitivity to flows between the U.S. and London and to physical buying in India - combine to produce a market that could tighten rapidly if a confluence of factors re-emerges.
For participants across investment, jewellery and industrial sectors, the takeaway is that structural deficits are expected to persist into 2026 even against a backdrop of weaker industrial consumption, and that episodic liquidity events remain a material risk.