Introduction
Trend following is a systematic approach that seeks to participate in persistent price moves by aligning positions with the prevailing direction of the market. It is typically implemented through rule sets that define trend detection, position sizing, and risk control. Despite its longevity across asset classes, trend following is constrained by several practical and statistical limits. Understanding these limits is essential for building structured, repeatable systems that behave as intended in live conditions.
This article defines the limits of trend following strategies, outlines the core economic and statistical logic that drives them, and discusses how these constraints influence risk management and system architecture. It also provides a high-level example to illustrate how a trend following process operates over different market regimes.
What Trend Following Tries to Capture
In simple terms, a trend following system accepts small, frequent losses in exchange for the possibility of episodic large gains. The core logic is asymmetry. When prices drift without clear direction, the system enters and exits often, accumulating modest losses or transaction costs. When a significant and sustained move occurs, the system attempts to stay aligned long enough for the profits from that move to more than offset earlier losses and costs.
This payoff shape depends on three features of markets. First, returns can be serially correlated over certain horizons, which creates periods where price changes are directionally persistent. Second, volatility tends to cluster, so large moves often come in bunches. Third, market regimes are not stable over time. There are cycles in which trends are common and cycles in which range-bound behavior dominates. Trend following seeks to harvest the former while surviving the latter.
Defining the Limits of Trend Following Strategies
The limits of trend following are the conditions and frictions that prevent the desired asymmetry from fully expressing itself. These include statistical properties of return series, nonstationarity in market regimes, microstructure and execution constraints, model specification risk, and portfolio capacity. A strategy can be logically sound but still fail to deliver expected results if these limits are not accounted for in research and implementation.
Limits are not only about losses during adverse periods. They also affect the speed at which a system adapts to new information, the robustness of outcomes to parameter changes, and the degree to which diversification reduces volatility. Each of these factors determines whether a trend following approach forms a reliable component within a broader, rule-based trading program.
Core Logic and Its Implications
The core logic of trend following can be summarized as rule-driven participation in directional moves with explicit loss containment. The strategy expects a low win rate paired with a higher average win size than loss size, and typically exhibits positive return skewness. This logic carries several implications that point directly to the limits of the approach.
First, because most trades are not large winners, turnover and costs matter. Small edge erosion from slippage and fees can overwhelm the intended asymmetry. Second, a slow system that filters noise may miss a portion of trend profits, while a fast system reduces delay but increases whipsaws. There is no single speed that dominates across regimes. Third, because trends can arrive in clusters, realized performance often depends on a small number of episodes. Calendar concentration creates periods of flat or negative performance even if the long-run statistics are attractive.
Sources of Limitation in Practice
1. Sideways markets and whipsaw risk. Trend following rules are designed to move with direction, not to predict it. When prices oscillate within a range, rule sets generate repeated entries and exits. Losses can be controlled, but the frequency of small losses rises, and transaction costs accumulate. Extended range-bound regimes compress the realized edge.
2. Regime shifts and nonstationarity. Relationships that looked stable in backtests can change abruptly. Periods of policy intervention, structural liquidity changes, or shifts in macroeconomic volatility alter the distribution of returns. Rules calibrated on one period may react too slowly or too quickly in the next, diminishing effectiveness.
3. Parameter sensitivity. Choices such as lookback windows, breakout thresholds, and volatility filters can significantly alter outcomes. If small parameter changes produce large performance swings in testing, the system may be overfit to historical quirks rather than robust features of trend behavior.
4. Crowding and capacity. When similar rules are deployed by many participants in the same instruments, entries and exits can cluster. Liquidity can thin during stress, widening spreads and increasing slippage. Capacity is finite. Beyond certain sizes, additional capital can degrade performance even if the rules remain unchanged.
5. Execution frictions. Slippage, gaps, and partial fills impair the idealized payoff. Live trading rarely achieves mid-quote fills. Gap risk is particularly relevant for trend systems, since many rules react to new information after it is incorporated into prices, not before.
6. Diversification limits. Cross-asset and cross-market diversification is a common way to stabilize outcomes. However, correlations can rise quickly during stress, reducing the benefits of spreading exposure. In addition, many markets that appear distinct share common trend drivers, which increases implicit concentration.
7. Data and measurement error. Backtests can be distorted by survivorship bias, lookahead errors, or unmodeled costs. Small inaccuracies compound when edges are thin. Realistic testing requires conservative assumptions about fills and fees, especially for higher turnover variants.
8. Path dependency and timing luck. Two traders following the same rules can realize different outcomes depending on the day of initiation or minor implementation choices. A few large trends captured early in a live track record can skew performance relative to peers who started later, even with identical logic.
9. Asymmetry is fragile. The intended profile of small losses and occasional large gains depends on rare events. A small number of missed trends, early exits, or partial allocations can change annual performance materially. The fragility of the edge demands strict process discipline.
Risk Management Considerations
Risk management in trend following is not a separate module that sits outside the strategy. It defines whether the strategy’s logic can express itself. The issues below are central to that expression and determine how the limits translate into realized results.
Position sizing and volatility targeting. Because return distributions are skewed and drawdowns can be deep, sizing rules aim to maintain a stable level of risk rather than a stable notional exposure. Volatility targeting, for example, adjusts position sizes when market variance changes. This supports more consistent risk but cannot eliminate the possibility of clustered losses during choppy regimes.
Loss containment and exits. Rules that cap losses curtail the impact of whipsaws, yet exits that are too tight can cut off trends prematurely. Rules that are too loose invite large single-trade losses or prolonged drawdowns. Every exit policy implies a trade-off between staying power and noise sensitivity.
Correlation control. Portfolios of trend systems often span multiple instruments and time horizons. Even when individual positions appear distinct, their risks can be correlated due to shared macro drivers. Aggregation rules that account for correlation prevent inadvertent concentration, especially during global episodes when many markets trend together or reverse together.
Leverage and drawdown management. Many liquid futures markets require leverage to express risk at meaningful levels. Leverage magnifies both edges and errors. Drawdown constraints and pre-defined de-risking protocols can bound adverse paths, but they also raise the risk of cutting exposure just before a trend resumes.
Transaction cost modeling. High turnover variants of trend following are particularly sensitive to costs. Conservative assumptions for spreads, market impact, and slippage in testing reduce the gap between backtest and live results. Cost controls protect the asymmetry that the system seeks to harvest.
Governance and rule stability. Frequent discretionary changes introduce timing luck and selection bias. A stable governance process that specifies when rules can be reviewed or modified helps preserve the intended statistical profile of the system.
How Trend Following Fits into Structured, Repeatable Systems
A structured system translates hypotheses about market behavior into explicit rules. Trend following fits naturally into this framework because it relies on measurable features such as price persistence, volatility regimes, and breakout behavior. The following elements support repeatability and help manage the known limits of the approach:
Data hygiene. Use consistent sources, handle roll conventions for futures, and document adjustments for corporate actions in equities. Data problems can create false trends or erase real ones, distorting both research and execution.
Out-of-sample testing. When possible, reserve data for validation and conduct walk-forward analysis. The goal is not to maximize historical returns but to assess whether the rules maintain their character across different periods and conditions.
Robustness checks. Evaluate parameter neighborhoods rather than single points. If performance collapses when a lookback or threshold changes slightly, the system may be brittle. Medium sensitivity to settings is common, but extreme sensitivity is a warning sign.
Stress tests. Simulate sudden rate changes, gap moves, and spikes in volatility to observe how the system behaves. A trend following program that only functions in calm conditions is misaligned with the environments where large moves often occur.
Realistic cost and liquidity modeling. Incorporate spread dynamics that widen during stress, partial fills, and position scaling under liquidity constraints. Capacity assessments should be conservative and should reflect the markets and timeframes traded.
Portfolio construction. Combine instruments and horizons deliberately. Shorter horizons respond quickly but carry cost drag. Longer horizons filter noise but accept larger drawdowns. A structured blend can reduce path dependency.
Monitoring and diagnostics. Track hit rate, average win and loss, skewness, turnover, and drawdown depth. The consistency of these statistics matters more than any single period of return, since they reveal whether the underlying mechanism is operating as designed.
A High-Level Example of Operation
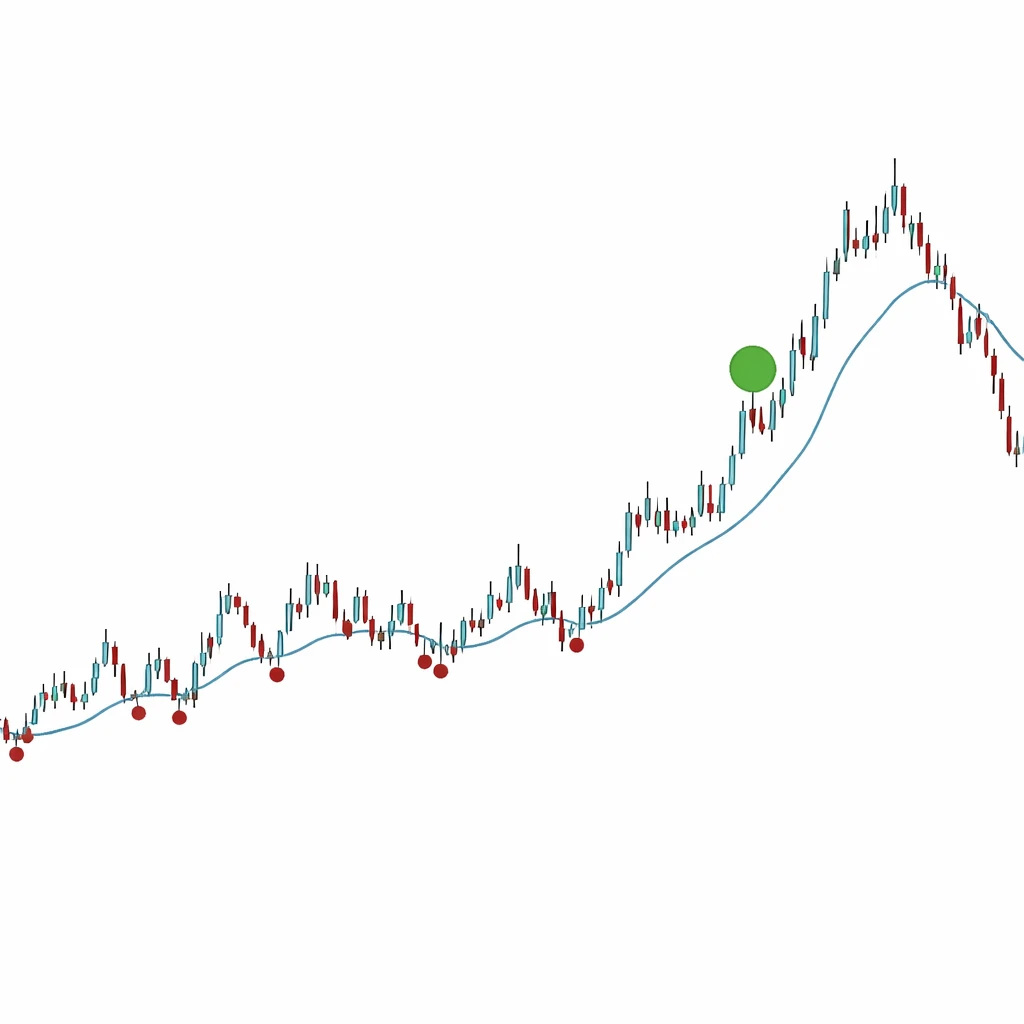
Consider a simplified, hypothetical program that monitors a diversified set of liquid futures. The rules identify directional persistence using a transparent trend definition, scale positions to a target risk level, and apply exits that limit losses and let winning positions run. Exact signals are omitted here by design. The example focuses on how the profile develops across regimes.
In Month 1, markets chop sideways. The system enters a few positions that reverse quickly. It realizes several small losses and incurs transaction costs. Risk controls keep the loss per trade contained, but the cumulative result for the month is modestly negative.
In Month 2, the environment remains range-bound. The system continues to probe for trends, with a similar pattern of small losses and occasional small gains. The risk monitors prevent concentration in correlated markets, so the overall drawdown remains manageable despite several losing trades across instruments.
In Month 3, a sustained directional move begins in a subset of markets. The system aligns in the direction of the move and holds as long as the trend remains intact. As volatility increases, position sizes adjust to maintain the intended risk level. Earlier losses are gradually recovered, and the month’s result turns positive.
In Month 4, the trend extends. The system maintains exposure, accepting normal pullbacks without exiting. The gains from the continuing move outweigh the prior two months of losses and costs. Portfolio-level risk remains controlled through volatility scaling and correlation-aware limits.
In Month 5, a sharp reversal occurs. The system exits according to its loss containment rules. Some profits are given back during the reversal, but the strategy still finishes the five-month sequence with a net gain because the Month 3 and Month 4 trend captured a large move.
This example highlights the core payoff dynamic. Many small losses in choppy environments are offset by a smaller number of large wins when a persistent move emerges. The limit is visible in Months 1 and 2, where costs and whipsaws dominate. The benefit is visible in Months 3 and 4, where sustained direction allows the rules to produce the intended asymmetry.
Measuring When Limits Are Binding
A trend following program must track whether the identified limits are actively constraining performance. Several diagnostics are useful for this purpose.
First, monitor the ratio of average win to average loss and how it evolves across time. A falling ratio can indicate that exits are prematurely cutting winners or that costs have risen. Second, track the frequency of trades per instrument and the cost per trade. Rising turnover without improvement in net outcomes points toward whipsaw conditions or parameter settings that are too sensitive.
Third, evaluate cross-market correlation of signals and returns. If many positions move together, the effective diversification is lower than expected. This may justify reviewing aggregation rules, not to enhance returns, but to align the realized risk with the system’s design.
Fourth, analyze attribution by regime. Classify periods into trend-friendly and trend-averse states using objective criteria, then assess how much of the long-run return comes from a small number of trend-friendly windows. High concentration is normal but should be well understood and explicitly modeled in planning and communication.
Variants and Their Specific Constraints
Trend following appears in many forms, including breakout approaches, moving-average structures, channel rules, and momentum filters. Each variant leans on similar logic but differs in its balance between speed and noise filtering.
Faster variants react quickly to new moves and exit quickly when conditions change. They tend to generate more trades and pay a higher cost per unit of gross edge. Their limit is cost drag and sensitivity to noise. Slower variants tolerate more noise, aiming to stay with sustained moves. They realize larger drawdowns and may give back more during reversals. Their limit is delayed adaptation and larger dispersion of outcomes across regimes.
Multihorizon blends attempt to reduce path dependency by combining fast and slow elements. This approach spreads the response across different time scales, but it does not eliminate the fundamental trade-off. Costs and drawdowns remain present, only redistributed.
Operational Constraints
Operational design can strengthen or weaken a trend following program regardless of the underlying rules. Execution tactics, order types, and routing policies influence slippage. Night sessions and illiquid hours affect gap risk and fill quality. For futures, roll management can introduce additional costs or directional noise if calendar spreads shift unexpectedly. For equities, corporate actions and index rebalancing can distort signals around rebalance dates.
Capacity grows more slowly than it appears. A system that trades small sizes may show minimal slippage in live results. As size increases, market impact rises nonlinearly. Historical volumes are imperfect guides to true capacity because liquidity often deteriorates precisely when trend systems become crowded. Conservative scaling plans and ongoing liquidity studies help ensure that portfolio growth does not erode the intended edge.
When Trend Following Aligns Poorly
Trend following is most challenged when markets alternate direction within tight ranges, when volatility spikes without directional follow-through, or when correlations across instruments rise but without a clear shared trend. In these states, the system can accumulate small losses while waiting for a sustained move. Environments dominated by policy shocks that reverse quickly are also difficult, since the system typically reacts after the price movement, not before.
Markets with limited liquidity present additional challenges. Wide spreads and sporadic prints can create false signals and large slippage. Even if the long-run logic holds, the realized results in such markets may fail to meet expectations because costs absorb the gross edge.
Common Misunderstandings
Several misunderstandings recur in discussions about trend following limits. It is useful to address them directly.
First, trend following is not a prediction method that forecasts turning points. It is a participation method that aligns with observed direction. Losses during reversals are not evidence of failure but a consequence of the rules.
Second, the low win rate is not a flaw. It is part of the design that expects a small number of outsized wins to dominate results. Changing rules simply to increase the win rate can degrade the payoff asymmetry that the approach relies on.
Third, adding more markets does not guarantee smoother returns. If those markets share drivers or become correlated under stress, diversification benefits can be smaller than expected. Portfolio construction must consider correlation, liquidity, and capacity, not just the count of instruments.
Fourth, risk controls do not eliminate drawdowns. They shape the path of returns and the dispersion of outcomes. Deep or prolonged drawdowns can still occur during extended periods without strong trends.
Implications for System Architecture
Recognizing the limits of trend following leads to practical implications for building structured systems. Research processes benefit from clear hypotheses about why trends should exist in the selected markets and horizons. Testing should prioritize stability of the payoff profile rather than peak historical returns. Implementation should reflect realistic frictions and capacity. Monitoring should emphasize whether the live behavior matches the design, including hit rate, loss containment, and skewness.
Communication and governance matter. A documented plan for reviewing rule performance, updating parameters within pre-defined ranges, and handling extended drawdowns reduces the risk of ad hoc decisions that harm the intended edge. A systematic approach treats the limits not as flaws to be engineered away, but as characteristics to be measured, managed, and incorporated into expectations.
Concluding Remarks
Trend following remains a coherent way to structure trading rules around observable price persistence. Its limits are clear and persistent. Sideways regimes generate whipsaws and cost drag. Regime shifts challenge parameter stability. Execution frictions and capacity reduce net outcomes. Diversification helps but does not eliminate correlated risk. A well-specified system accepts these constraints and is designed so that the occasional large moves that drive long-run results can emerge with minimal interference from costs and operational friction.
In practice, the value of understanding these limits lies in improved design discipline. Systems that recognize their exposure to noise, their sensitivity to parameters, and their dependence on rare but significant trends are better equipped to function as repeatable components in a broader trading program.
Key Takeaways
- Trend following relies on a few large gains offsetting many small losses, which makes it sensitive to costs, parameter choice, and execution quality.
- Sideways regimes, regime shifts, and correlation spikes are primary sources of limitation that compress the intended payoff asymmetry.
- Risk management defines the strategy’s viability through sizing, loss containment, correlation control, and governance rather than through forecasts.
- Diversification across markets and horizons helps but cannot remove capacity constraints or correlated drawdowns during stress.
- Structured system design, conservative testing, and ongoing diagnostics are central to managing the known limits of trend following.