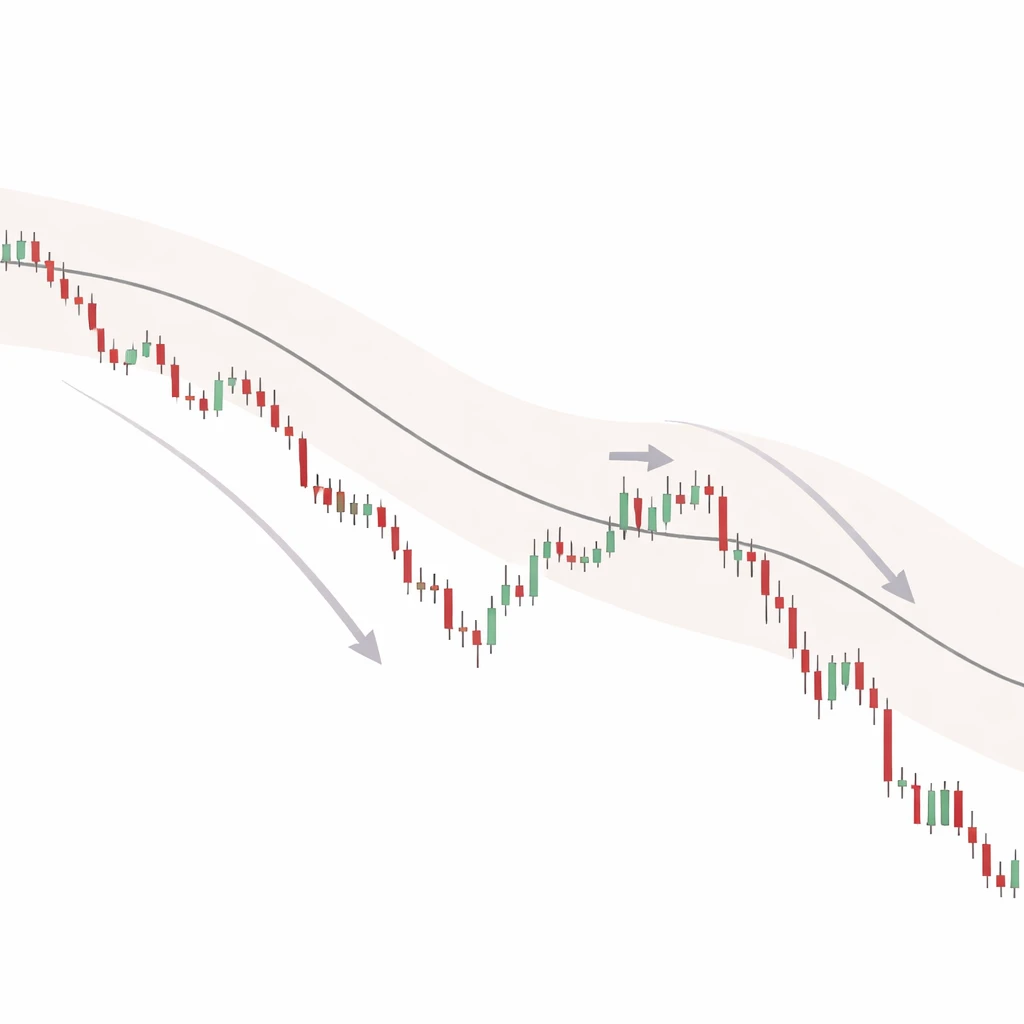
Mean reversion is the idea that prices tend to fluctuate around a central tendency and that extreme deviations are more likely to move back toward that central level than to keep extending. In practice, many markets exhibit episodes where prices do revert, but not all apparent reversions succeed. A false reversion occurs when price initially moves back toward a reference mean after an extreme deviation, creates the appearance of a reversion, and then fails by resuming the prior displacement or extending beyond it. False reversions matter because they often arrive with sharp changes in volatility, liquidity, and order flow. Treating them as a distinct state helps prevent a mean-reversion system from fighting adverse conditions and enables the construction of systematic rules that recognize when reversion attempts are fragile.
Defining False Reversions
A false reversion is a specific path-dependent event. The sequence typically has three elements:
- An identifiable deviation from a reference mean or equilibrium zone. That reference might be a moving average, a rolling median, or a model-based fair value.
- A partial recovery or pullback toward the reference zone that suggests reversion is underway.
- A subsequent failure of that recovery, followed by renewed movement in the direction of the original displacement or a fresh extension away from the mean.
These events are distinct from simple trend continuation. The short-lived recovery is the feature that lures mean-reversion logic into expecting normalization. When that recovery stalls and reverses, the system faces a classification problem. If it continues to treat the situation as mean reversion, losses can compound quickly. If it recognizes the failure as a separate state, it can adapt position sizing, reduce exposure, or consider continuation logic within a controlled framework.
Why False Reversions Occur
False reversions are common because financial markets mix heterogeneous participants, time horizons, and constraints. Several mechanisms can generate the pattern:
- Inventory and liquidity dynamics. After a persistent move, liquidity providers may widen spreads and reduce displayed size. An initial bounce toward the mean can be driven by short covering or profit taking rather than the arrival of new long-horizon demand. Once that transitory order flow is absorbed, the deeper drivers reassert themselves and the bounce fails.
- Volatility regime shifts. The average size of price changes is not constant. A reversion threshold calibrated to a quiet regime may be too tight when the market transitions to a high-volatility regime. The first snapback raises hopes of normalization, but the broader volatility backdrop remains unstable, and the move reverses again.
- Behavioral feedback. Traders conditioned by prior mean-reverting episodes may enter quickly when a deviation appears large. If many do so at once, the initial reversion can be crowded and fragile. When it does not progress, exit flows can cascade and reinforce failure.
- Information arrival. New information, including macro data or earnings guidance, can change the equilibrium level. The first bounce reflects uncertainty and position squaring. As the new information is digested and priced, continuation dominates, and the earlier reversion attempt is revealed as false.
Each mechanism highlights a common theme. False reversions are usually a clash between short-horizon mean-reversion behavior and longer-horizon forces that have not exhausted themselves. Recognizing this clash is essential for designing rules that either sidestep fragile reversions or harness the failure as its own tradable pattern within a disciplined system.
Core Logic Behind a False Reversion Strategy
A strategy that addresses false reversions can serve two roles. It can act as a defensive overlay that reduces the aggressiveness of mean-reversion exposure when the reversion looks fragile, or it can be built as a separate continuation-oriented component that activates only when a reversion attempt fails. In both roles, the logic rests on careful state definition rather than price prediction.
At a high level, the system distinguishes at least four states:
- Normal: price oscillates near the reference mean.
- Deviated: price exhibits a large standardized displacement from the mean.
- Reversion attempt: price moves back toward the mean by a nontrivial fraction of the displacement.
- Failure: the reversion attempt stalls and price re-accelerates away from the mean, usually confirming momentum in the original direction.
The rules that partition these states typically rely on normalized measures. For example, displacement may be measured as a z-score relative to a rolling mean and volatility, or as a percentile of a robust distribution estimator. Reversion attempts can be defined by partial offsets of that z-score or by returns that reduce the distance to the mean across several bars. Failures can be identified when the recovery loses traction and a momentum proxy in the prior direction resumes above a minimal threshold. The exact thresholds, lookbacks, and momentum proxies depend on the instrument, time horizon, and execution costs, and should be validated out-of-sample.
Two design principles help the logic remain robust:
- Regime conditioning: thresholds adapt to realized volatility and trend strength. What qualifies as an extreme in a quiet regime differs from an extreme in a turbulent regime.
- Confirmation: declare failure only after observing evidence that the reversion has lost force. Premature classification drives whipsaws and cost leakage.
By embedding these principles, a false-reversion component reduces the tendency to average into losses during adverse conditions and creates a structured path to treat failed reversions as information rather than noise.
How It Fits into a Structured, Repeatable Trading System
False-reversion logic integrates naturally into a modular system. A practical architecture may include:
- Signal module: computes standardized displacement, evaluates reversion attempts, and flags potential failures. Uses robust statistics to mitigate outliers and stale prices.
- Regime module: estimates volatility regimes and trend states using rolling volatility, realized kurtosis, and a simple slope or filter on the reference mean.
- Decision module: maps the state to actions. When a failure is flagged, it may reduce or neutralize existing mean-reversion exposure. In a dedicated component, it may assign a continuation bias that is subject to strict risk limits.
- Execution module: translates the decision into orders while accounting for slippage, spreads, and market impact. Uses conservative assumptions for backtesting.
- Risk module: sets limits on per-trade risk, portfolio concentration, and drawdown. Applies volatility scaling so that exposures are comparable across regimes.
- Monitoring module: tracks live performance metrics, including class balance between true and false reversions, to detect drift or deterioration.
Repeatability comes from consistent definitions, clear thresholds, and unambiguous state transitions. Each module should be testable on its own, then validated as part of the whole system using robust out-of-sample procedures.
High-Level Example of Operation
Consider a liquid index future on a daily timeframe. The system defines a rolling mean and a rolling volatility estimate. Over several days, price drops well below the mean, creating a large negative standardized displacement. On day one after the low, price rallies toward the mean and reduces the displacement by a meaningful fraction. That rally continues mildly on day two but stalls below the mean. On day three, price fails to make further progress and intraday data show renewed downside acceleration. The reversion attempt is then classified as failed.
In a defensive overlay design, the mean-reversion component would reduce or neutralize its exposure once the failure is classified. In a continuation-oriented component, the system would record a downward continuation bias for a defined evaluation window, governed by pre-set risk limits and time-based criteria. In either case, the decision is not a discretionary judgment about macro conditions. It is a rule-based response to the sequence of displacement, partial reversion, and failure.
A parallel example exists on the upside. After a strong rally that pushes price far above the reference mean, a two-day pullback seems to restore balance. The pullback stalls, upside momentum reappears, and the pullback is classified as a false reversion. The continuation bias would then point in the direction of the prior rally, again within defined risk bounds and with explicit invalidation criteria.
False reversion logic also applies to relative value. Consider a market-neutral spread where the price of a stock relative to its sector index deviates below a rolling ratio mean. The stock outperforms briefly, the ratio mean narrows, and then the outperformance fizzles as sector flows dominate. The initial normalization is revealed as a false reversion of the spread. The same state machine can be applied to the ratio rather than the outright price.
Measurement and Validation
A system that recognizes false reversions should be measurable. Three elements are critical:
- Labeling: specify an objective way to label past events as true or false reversions. For example, after a reversion attempt, define a fixed evaluation window and check whether price spent more time or distance continuing away from the mean versus completing a reversion.
- Base rates: estimate how often reversion attempts fail in the instrument and timeframe of interest. Base rates vary across assets and regimes. Ignoring them leads to unrealistic expectations of hit rates.
- Performance decomposition: evaluate outcomes by state. Compare the distribution of returns when the system flags a failure to when it does not. This clarifies whether the state definition carries information beyond noise.
Validation should include robust backtesting practices:
- Walk-forward analysis: calibrate thresholds on an initial period, then roll forward and test out-of-sample. Avoid reusing the same data for tuning and evaluation.
- Transaction cost modeling: include spreads, slippage, and market impact that reflect the intended trade size and liquidity profile.
- Parameter sensitivity: verify that performance is not overly dependent on a single lookback or threshold. Reasonable ranges should produce similar qualitative behavior.
- Subperiod and regime checks: test across calm and turbulent regimes, as well as different time-of-day or day-of-week segments if operating intraday.
- Risk-adjusted metrics: measure drawdowns, tail losses, and skewness, not just average returns. False reversion strategies often have lumpy payoffs.
These steps help ensure the logic captures a persistent feature of market behavior rather than a historical artifact.
Risk Management Considerations
False reversions are associated with sharp swings and non-linear paths. Risk controls must reflect that profile.
- Position sizing via volatility scaling: scale exposure inversely with recent volatility so that risk per decision is more stable across regimes. This prevents the system from taking the same nominal size in a high-volatility state as in a quiet state.
- Clear invalidation criteria: define the conditions under which a continuation bias or a reduced-exposure stance is no longer valid. Invalidation can be time-based, path-based, or based on a secondary indicator that contradicts the failure state.
- Time stops: false reversion dynamics often resolve quickly. If continuation does not progress within a set evaluation window, the informational edge may decay.
- Portfolio concentration limits: cluster risk arises when multiple instruments experience the same regime shift. Set aggregate exposure limits that account for correlations, not just single-instrument risk.
- Gap and event risk handling: scheduled announcements can create discontinuous price changes. Decide in advance whether the system will hold exposure through such events or reduce risk. Reflect this choice in backtests so that results are consistent with live rules.
- Execution discipline: fast failure events can widen spreads and shallow the order book. Use execution tactics that limit slippage, such as slicing orders or adjusting participation rates in proportion to liquidity.
Importantly, avoid rules that average into adverse moves solely because price has moved further from the mean. False reversion states are defined precisely by the inability of price to complete the mean reversion despite an initial bounce. Averaging up or down without a clear, validated signal risks compounding losses during persistent extensions.
Practical Design Choices
Design choices affect both robustness and implementability.
- Reference mean and dispersion: simple moving averages are common, but alternatives like exponential moving averages, rolling medians, or Kalman-filtered estimates can be used. Dispersion estimates can use standard deviation, average true range, or robust measures such as median absolute deviation to reduce sensitivity to outliers.
- Multiple horizons: a short-horizon reversion attempt may fail while a longer-horizon mean remains far away. Consider a hierarchy of means to avoid conflicting signals.
- Momentum proxy: the failure classification often uses a minimal momentum threshold in the original direction. This can be as simple as a rate-of-change measure or a filtered price slope.
- Volume and liquidity context: weak reversions during declining volume may be more fragile. Conversely, continuation backed by rising volume can strengthen the failure classification. Liquidity metrics also help decide whether execution conditions are acceptable.
- Normalization across assets: if the system runs on a portfolio, standardize features so that thresholds are comparable. This avoids implicit over-allocation to the noisiest instruments.
- Computation and latency: intraday implementations must consider data quality, timestamp alignment, and processing latency. The rules should be simple enough to compute reliably in real time.
These choices should be finalized only after systematic testing that reflects transaction costs and realistic execution assumptions.
Common Pitfalls
Several errors recur when building false-reversion logic:
- Overfitting to rare episodes: tailoring thresholds to a handful of dramatic failures can impair generalization. Balance sensitivity with robustness across ordinary conditions.
- Ignoring base rates: in some instruments, true reversions dominate most of the time. A system that constantly expects failure will incur cost leakage and missed opportunities.
- Unlabeled overlap between states: ambiguous transitions between reversion and failure states create whipsaws. Use clear, non-overlapping conditions and require minimal confirmation.
- Underestimating transaction costs: false-reversion patterns can be brief. If the cost per decision is high relative to the expected edge, the system may not be viable at the intended frequency.
- Survivorship and look-ahead bias: ensure the dataset includes delisted instruments when testing single names and avoid using future information in calculated features.
Extensions and Variations
False-reversion awareness can be adapted to different contexts.
- Options overlays: some practitioners prefer to modulate convexity by structuring exposure with options, for example, adjusting delta when a failure is flagged. This can reshape tail risk, subject to liquidity and implied volatility considerations. Any option-based approach requires additional modeling of decay and skew.
- Pairs and spreads: the logic extends to spreads such as stock versus sector, futures calendar spreads, or currency crosses. The mean is then a relationship rather than an outright price. Spread microstructure and carry must be incorporated into validation.
- Intraday to multi-day scopes: intraday false reversions often revolve around opening gaps and midday liquidity cycles. Multi-day patterns are more influenced by macro news cycles and positioning data. The same state machine can operate at both levels with appropriately scaled parameters.
- Hybrid systems: combining mean reversion, false-reversion continuation, and trend modules can create a diversified set of micro-edges. The allocation among modules can be dynamic, based on regime assessments and recent calibration diagnostics.
Illustrative Numerical Logic Without Signals
To make the idea concrete without providing actionable signals, consider the following stylized structure. Assume a rolling mean over a moderate lookback and a volatility estimate over a shorter lookback. The system computes a standardized displacement at each step. If displacement exceeds a large threshold, the state becomes Deviated. If price then moves back toward the mean sufficiently to reduce the displacement below a lesser threshold, the state becomes Reversion Attempt. If, within a fixed evaluation window, the rate-of-change in the original direction exceeds a small positive threshold and the displacement expands again, the state becomes Failure. The system then applies the decision rules associated with Failure, which may include de-risking any mean-reversion exposure or activating a continuation bias with defined limits.
This description is intentionally abstract. The intent is to show how a state machine framework can be built to identify false reversions systematically, not to propose specific entry or exit methods. Every threshold and lookback must be validated empirically on the targeted instruments and frequencies.
Interpreting Outcomes and Managing Expectations
False-reversion strategies often have a payoff profile that differs from classical mean reversion. They may exhibit lower hit rates but larger average gains on successful classifications, since a failed reversion can precede a directional extension. They may also produce clusters of outcomes due to regime persistence. These features require patience and rigorous drawdown controls. Monitoring the mix of states over time helps detect structural changes, such as a prolonged environment where reversions succeed more often than they fail, or vice versa.
Evaluation should consider not only profitability but also informational content. If the Failure state consistently coincides with larger absolute next-window returns than the Reversion Attempt state, the model is capturing a useful conditional feature of market behavior even if standalone results are modest. That information can still inform risk allocation within a multi-strategy portfolio.
Putting It All Together
False reversions are an important counterpart to mean reversion. They acknowledge that the path to equilibrium is not linear and that short-lived recoveries can be deceptive. By defining a repeatable set of states, confirming failure with simple, robust signals, and embedding the logic within a disciplined risk and execution framework, a system can treat false reversions with structure rather than intuition. The goal is not to guess turning points but to respond consistently to evidence that a reversion is faltering.
Key Takeaways
- False reversions are reversion attempts that stall and then resume movement away from the mean, often in the original direction of the displacement.
- They emerge from liquidity dynamics, volatility regime shifts, behavioral feedback, and new information that changes the equilibrium level.
- A structured state machine with regime conditioning and confirmation rules can identify false reversions and integrate them into a repeatable system.
- Risk management should emphasize volatility scaling, clear invalidation, time stops, and portfolio concentration limits due to the lumpy nature of outcomes.
- Validation requires careful labeling, base-rate estimation, cost-aware backtesting, and sensitivity analysis to avoid overfitting and bias.