A breakout strategy is a rule-based approach that attempts to participate in directional price movement when the market leaves a defined area of balance. The essential idea is simple. Markets often alternate between consolidation and expansion. When price pushes beyond the boundary of a consolidation with sufficient follow-through, a new phase of trend or volatility expansion may begin. A breakout system encodes how to define the boundary, how to recognize a valid breach, and how to control risk while the trade hypothesis plays out.
Breakout strategies are among the oldest systematic techniques in markets. They appear in futures trend following, equity momentum, currency trading, and even intraday approaches. Their appeal lies in their structured logic and their potential to be tested across instruments and timeframes. Their challenge lies in false signals, slippage around fast moves, and the need for robust risk controls that are consistently applied.
Defining a Breakout Strategy
A breakout strategy seeks participation when price closes or trades beyond a pre-specified level that has contained price for a meaningful period. The level can be horizontal, such as the high of a recent range, or dynamic, such as a boundary defined by a volatility band or a trendline. In all cases, the system must articulate the following elements in advance:
- How the boundary is defined and maintained through time.
- What constitutes a valid breach of that boundary.
- How to size risk relative to volatility, capital, and portfolio constraints.
- How to manage the trade after entry, including conditions for exit.
These elements allow the approach to be applied consistently and evaluated using historical data. The goal is not to predict specific outcomes but to enforce a repeatable response to a recurring market condition.
Market Structure Behind Breakouts
Breakouts depend on the interplay between balance and imbalance in order flow. During consolidation, buyers and sellers transact around a perceived fair value. Liquidity clusters near the boundaries of this range because many participants anchor their orders near recent highs and lows. If a fresh wave of orders absorbs the liquidity at one boundary and pushes price beyond it, the distribution of future trades can shift. The shift is often reinforced by secondary effects such as resting stop orders, systematic strategies that trigger on new highs or lows, and discretionary traders who respond to perceived regime change.
Common structures that yield breakout setups include:
- Horizontal ranges. Repeated highs and lows form a rectangle of balance. A breach of the top or bottom seeks to capture directional expansion.
- Chart patterns. Triangles, flags, and rectangles compress volatility and create clear boundaries that traders monitor. The specific pattern label is less important than the observed contraction in range.
- Volatility bands. Adaptive bands such as those derived from recent standard deviation or true range approximate statistically unusual moves. A close beyond such a band can signal volatility expansion.
- Opening ranges. The early session defines an initial high and low. A move beyond that bracket can be used to trade intraday momentum, especially in markets with concentrated open auction dynamics.
None of these structures guarantees continuation. They simply provide a repeatable way to define a boundary and detect when price leaves it.
Core Logic of Breakout Strategies
The logic rests on several ideas from market microstructure and behavioral finance. First, order flow is not uniformly distributed. Resting liquidity tends to cluster at obvious reference points such as recent extremes. When those levels are tested, the balance can flip if new market orders continue to arrive in the same direction. Second, many participants react to the same signals. Systematic funds that respond to new highs or lows add to the initial push. Third, behavioral biases such as anchoring and herding can amplify moves as traders update beliefs about fair value after the boundary is breached.
Breakouts also capture volatility regime shifts. Price contraction often precedes expansion. When realized volatility is low and compressing, the energy stored in the range occasionally releases into a directional move. Breakout rules attempt to synchronize with that release while capping risk if the move fails.
These effects are probabilistic. A large fraction of breakouts retrace back into the range. The strategy must therefore be built around asymmetric risk and return. The win rate may be modest, but the profits on sustained trends can exceed the losses from failed attempts if risk is cut decisively.
Types of Breakout Approaches
Range Breakouts
Range breakouts define a lookback window, identify the highest high and lowest low, and trigger participation when price moves beyond one of those extremes. The approach assumes that a new directional phase can emerge once the market accepts prices outside the recent bracket. Range definitions vary across timeframes, from intraday bars to multi-week windows, but the logic is the same.
Volatility Band Breakouts
Volatility band methods use adaptive boundaries derived from recent variability. For example, an upper band might be placed several units of average true range above a moving reference. A move beyond the band indicates an unusually strong impulse. Since the band adapts to recent volatility, these methods scale the boundary with market conditions. The trade-off is sensitivity to sudden spikes and mean-reverting shocks.
Pattern and Structure Breakouts
Patterns such as symmetrical triangles or flags describe price compression along sloping boundaries. A break of the pattern line can indicate that the consolidation has ended. Traders sometimes prefer these structures because they provide unambiguous boundaries drawn from swing highs and lows. The method is visually intuitive but still requires clear rules for validation and risk control.
Opening Range Breakouts
Some markets display distinct behavior around the open, when overnight information is incorporated into prices. An opening range breakout uses the initial minutes to define a bracket, then participates in moves beyond that early range. Because liquidity and volatility are both elevated near the open, slippage and false breaks can be pronounced. Robust filters and realistic execution assumptions are essential in testing.
Validating a Breakout: Filters and Confirmations
Breakouts fail frequently. Structured filters can reduce false signals but typically add delay and lower trade frequency. Common validation tools include:
- Time confirmation. Require a close beyond the level or a minimum number of bars accepted outside the range, which reduces the impact of brief spikes.
- Volume expansion. Look for participation that exceeds recent averages, suggesting conviction. Volume filters can be helpful in equities and futures with transparent volume but are not available in some markets.
- Retest acceptance. After the initial breach, a pullback that holds near the broken boundary can indicate stronger acceptance. This reduces the risk of chasing extended moves but may miss fast trends.
- Volatility regime filters. Avoid breakouts during exceptionally low or high volatility if testing shows poor outcomes in those regimes.
- Higher timeframe alignment. Some systems only act on lower timeframe breakouts that align with a higher timeframe trend, which can improve persistence at the cost of fewer trades.
Each filter changes the distribution of outcomes. The important point is to encode them quantitatively and test them with realistic assumptions about costs and slippage.
Risk Management Considerations
Risk management is central to breakout strategies because the failure rate of individual attempts can be significant. The following components are typical in a structured system:
- Position sizing. Risk is often defined as a fraction of capital per trade, scaled by recent volatility. This keeps losses comparable across instruments and timeframes, even when price ranges differ substantially.
- Initial risk definition. An initial stop is commonly placed in a location that invalidates the breakout hypothesis, such as back inside the prior range or a set distance based on recent true range. Structure-based and volatility-based methods each have merits. Structure-based stops can be tighter when boundaries are well defined. Volatility-based stops adapt to changing conditions but may be further from entry.
- Execution and slippage. Breakouts often move quickly, which raises slippage risk. Simulated performance should include slippage assumptions that increase with volatility and lower liquidity. For instruments that gap between sessions, the possibility of price skipping through the stop needs to be considered.
- Trade management. Management rules can include trailing stops, partial de-risking at milestones, or time-based exits when momentum decays. There is no universally optimal method. The goal is internal consistency with the breakout logic and historical evidence.
- Portfolio constraints. If multiple instruments break simultaneously during a macro shock, correlation can surge. Caps on aggregate risk, sector concentration, and directional exposure help prevent over-commitment to one theme.
- Event risk. Scheduled announcements can create gaps that invalidate signals or overwhelm stops. Some systems pause around events or adjust risk. Any such rule should be explicit and testable.
Well-specified risk controls allow a breakout strategy to survive the inevitable periods of whipsaw, which are part of the approach. Without them, a string of failed signals can erode capital quickly.
How Breakout Strategies Operate in Practice
At a high level, a breakout system proceeds through four stages: setup identification, trigger, risk definition, and trade management. The following conceptual example illustrates these stages without prescribing exact signals or prices.
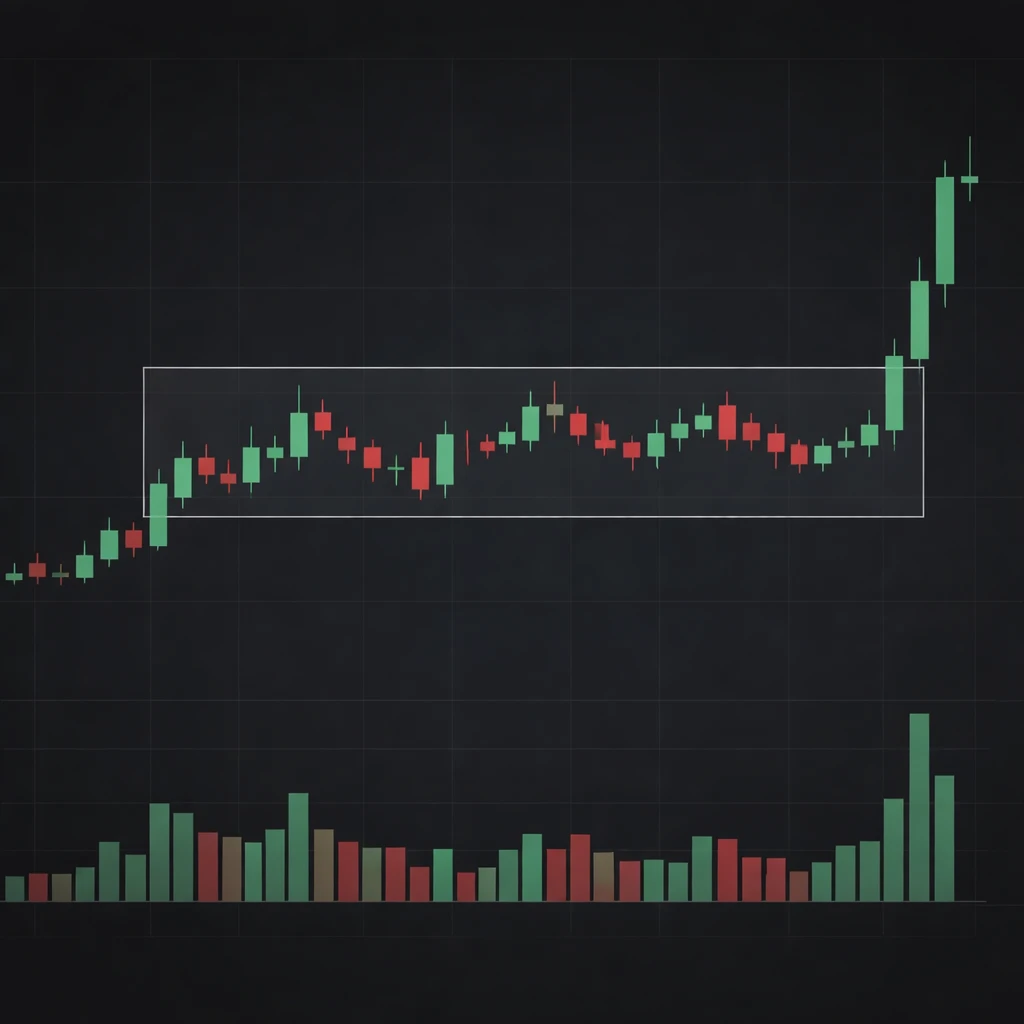
- Setup identification. A liquid instrument trades within a bounded range for several weeks. The upper boundary has been tested multiple times without acceptance above it. Range width has narrowed compared with earlier volatility, indicating compression.
- Trigger. The instrument posts a decisive session beyond the upper boundary. The system requires evidence of acceptance, such as a close beyond the boundary or sustained trading outside the range. Optional filters may include heavier-than-usual participation or alignment with a higher timeframe direction.
- Risk definition and sizing. The strategy assigns a fixed fraction of capital at risk on the trade. It calculates recent volatility to infer an approximate distance to a protective stop that would invalidate the breakout thesis. Position size is derived from the allowed risk and the distance to the stop.
- Management. If price accelerates in the breakout direction, the system may trail risk using a volatility-based stop or a structure-based method that follows new swing levels. If momentum fades or the market returns into the prior range, the protective stop removes the position to conserve capital.
This flow preserves the logic that the market revealed new information by leaving its prior balance. It also preserves the willingness to exit when that premise no longer holds.
When Breakouts Tend to Excel or Struggle
Breakout strategies are path dependent. Their outcomes depend on the environment around the signal, not only the signal itself.
- Supportive conditions. Sustained trends, healthy liquidity, and moderate-to-rising volatility support follow-through after a breach. Environments with steady information flow and low mean reversion are typically favorable.
- Challenging conditions. Choppy, range-bound regimes with frequent reversals can lead to repeated small losses. When liquidity is thin, small orders can move price through obvious levels and then reverse as larger participants fade the move. Overcrowded consensus trades can also produce sharp failure as trapped traders exit.
Because regimes change, many systematic portfolios combine breakout logic with complementary approaches such as mean reversion or carry. Diversification across instruments, timeframes, and methodologies can reduce reliance on a single environment.
Backtesting and Validation
Breakout strategies lend themselves to historical testing because levels and triggers can be expressed in explicit rules. Several cautions are important when evaluating results.
- Data quality. Ensure that price series are adjusted appropriately for dividends, corporate actions, contract rolls, and holidays. For intraday systems, align timestamps and handle missing bars consistently.
- Transaction costs and slippage. Model fees, bid-ask spreads, and slippage that scale with volatility and liquidity. Breakouts often coincide with wide spreads and fast tape, so naive assumptions can overstate performance.
- Overfitting and data snooping. Repeatedly optimizing lookback windows, band multipliers, and filter thresholds on the same data can produce fragile rules. Use out-of-sample testing, cross-validation, or walk-forward analysis to assess stability.
- Multiple comparisons. When many parameter sets are tested, some will appear to work by chance. Techniques such as White’s reality check or false discovery controls can help quantify the risk of spurious findings.
- Execution realism. Signals that trigger on bar extremes can be impossible to capture at those prices. Use conservative assumptions for fills and account for gaps, partial fills, and market impact in less liquid names.
Robust systems tend to show performance that is consistent across nearby parameter values and across instruments with similar characteristics. Fragile systems often rely on narrow parameter choices or specific historical episodes.
Measurement and Expectations
Because individual breakout trades can have low win rates, evaluation should emphasize distributional properties rather than any single trade. Useful statistics include:
- Expectancy per trade. The average profit or loss per trade, net of costs, which reflects the balance between win rate and average win relative to average loss.
- Payoff ratio and win rate. Breakout methods often depend on a payoff ratio greater than one to offset lower win rates. Monitoring both provides insight into shifts in behavior.
- Average holding period. Longer holding periods after breakouts can indicate sustained trends, while very short durations may signal a whipsaw environment.
- Maximum drawdown and time under water. These describe the worst historical decline and the persistence of losses, both of which affect practical deployability.
- Turnover and capacity. High turnover strategies may be sensitive to costs. In less liquid instruments, capacity constraints can be binding during breakouts.
Set expectations around variability. Periods of repeated small losses are part of the process. The objective is a positive long-run edge with controlled downside, not perfection on each attempt.
Instrument and Timeframe Considerations
Breakout logic is portable, but execution details vary by asset class and timeframe.
- Equities. Corporate events and overnight gaps create discontinuities. Volume-based filters can be informative, and opening range dynamics often matter.
- Futures. Centralized venues and deep liquidity can favor trend persistence, though contract rolls and limit moves require attention. Position limits and margining influence risk management.
- Currencies. Continuous trading and sessions with distinct liquidity cycles can affect intraday breakouts. Volume data are less informative in spot markets, so price-based measures dominate.
- Digital assets. Continuous trading and variable liquidity across venues can produce abrupt moves. Exchange selection and data integrity are material considerations.
Timeframe selection shifts the balance between signal quality and frequency. Higher timeframes reduce noise and trading costs but may react slower. Lower timeframes offer more opportunities but demand tighter execution discipline and cost control.
Common Pitfalls
Several recurring issues undermine breakout strategies when left unaddressed:
- Anticipating the break. Entering before the level is breached can improve price but increases the chance of being trapped inside the range. If anticipation is used, it should be encoded with clear criteria and tested separately from post-break entries.
- Chasing extended moves. Entering far from the boundary raises downside if the move snaps back. Time or distance limits can prevent late entries but may reduce participation in fast trends.
- Ignoring regime change. A system tuned to a specific volatility regime can suffer when conditions shift. Adaptive parameters and periodic review help maintain relevance.
- Insufficient cost modeling. Underestimating slippage during spikes can turn a marginal edge into a negative one. Conservative assumptions are prudent in test design.
- Overcrowding. Popular levels can draw attention from many participants, increasing whipsaw risk. Diversifying signals across instruments and timeframes can mitigate concentrated exposure to a single level.
Integrating Breakouts into a Structured System
A breakout module fits naturally within a broader trading architecture. The system defines universe selection, data processing, signal generation, risk allocation, and execution. Within that flow, the breakout logic contributes a specific type of exposure that tends to perform during trending or expanding volatility regimes. Allocation controls determine how much capital the module receives based on risk, correlation with other modules, and recent performance stability.
Documentation and version control are important. Every rule, threshold, and filter should be recorded, including the rationale and the evidence supporting it. Changes should be introduced through a deliberate research process, with out-of-sample validation before adoption. Consistent logging of trades, slippage, and exceptions helps maintain discipline and supports ongoing evaluation.
A High-Level Example
Consider a liquid instrument that has oscillated within a relatively narrow band for several weeks. Daily ranges have compressed, and realized volatility is below its recent average. The system tracks the upper boundary of this consolidation using objective rules such as highest close or a quantified range definition. One day, price accepts above the boundary during the session and closes outside the prior range. Volume is heavier than usual, and the broader sector is also advancing.
The strategy, following its rules, recognizes a valid breakout. It calculates position size so that a predefined fraction of capital would be lost if price returns to a level that invalidates the breakout hypothesis. The trade is now live. Over the next several sessions, price advances, pauses, and then advances again. The trailing risk method ratchets upward as new swing levels form, locking in progress while allowing room for normal fluctuation. Eventually, momentum wanes and the system’s exit criterion is met. The position is closed according to plan.
In an alternate path, price might have slipped back into the prior range shortly after entry. In that case, the protective stop would have removed the position for a controlled loss. Both outcomes are consistent with the strategy’s design. The key is that the decision rules did not rely on discretion in the moment.
Why Structure Matters
Breakout strategies invite emotional reactions because failures can cluster and successes can extend unusually far. A structured, repeatable framework mitigates this by reducing ad hoc decisions. Structure also enables cumulative learning. With consistent rules, performance can be decomposed by instrument, timeframe, volatility regime, and filter choice. This supports iterative improvement while guarding against overfitting.
Finally, structure helps align expectations. The typical breakout system will experience strings of small losses punctuated by larger gains. Capital allocation, drawdown tolerance, and evaluation horizons should be chosen with that profile in mind. With realistic assumptions and disciplined risk management, breakout logic can serve as a coherent component within a diversified systematic program.
Key Takeaways
- A breakout strategy codifies participation when price leaves a defined area of balance and seeks to capture the subsequent directional or volatility expansion.
- Clear definitions of boundaries, triggers, and risk controls are essential for repeatability and testability across markets and timeframes.
- Breakouts are probabilistic. False signals are common, which makes position sizing, protective stops, and execution assumptions critical.
- Filters such as time confirmation, volume expansion, and higher timeframe alignment can reduce noise but also reduce frequency and add delay.
- Robust evaluation requires realistic cost modeling, out-of-sample testing, and ongoing monitoring by regime, instrument, and parameter stability.