Breakout strategies seek to capture directional movement when price escapes a well-defined boundary such as a prior high, a consolidation range, or a trendline. Many traders filter these events using volume. The central idea is simple: a breakout that attracts broad participation is more likely to persist than one that occurs on thin activity. This article defines volume confirmation in breakouts, explains the logic that supports it, and outlines how it fits within structured, repeatable trading systems. It also discusses risk management considerations and provides a high-level example without specifying exact signals.
What Is a Breakout and Why Volume Matters
A breakout occurs when price moves beyond a level that previously contained it. The level might be a horizontal resistance created by multiple failed rallies, the upper boundary of a tight range, the neckline of a chart pattern, or a statistically derived band. Breakouts can occur on any timeframe. On shorter horizons they are often associated with intraday liquidity pockets, while on higher timeframes they may coincide with macro news, fundamental revaluations, or changes in market regime.
Volume represents the number of shares, contracts, or units traded over a given period. While price shows the outcome of negotiation, volume indicates how many participants engaged during that negotiation. When a breakout occurs with increased volume relative to recent activity, the event often reflects a meaningful shift in the supply and demand balance. Participation from larger or more diverse groups of traders, including institutional desks, tends to require more transactions, which shows up as elevated volume.
Defining Volume Confirmation in Breakouts
Volume confirmation in breakouts refers to conditioning a breakout signal on the presence of unusually high trading activity. The word unusual is important. Traders rarely evaluate raw volume in isolation. Instead, they compare current volume to a benchmark such as a trailing average, a percentile rank within a lookback window, or an intraday time-of-day profile that accounts for the natural ebb and flow of activity.
In practice, volume confirmation can be described as follows: after price trades beyond a defined boundary, the move is considered valid only if volume is higher than what is typical for that instrument and timeframe. The confirmation can be applied at the moment of the breakout or within a brief window after it, and some designs require sustained volume across multiple bars rather than a single spike.
Core Logic Behind the Strategy Type
The logic relies on market microstructure and behavioral effects.
- Supply and demand imbalance. When a level breaks, resting stop orders and new market orders may cluster. If many orders execute, volume rises. High volume indicates that a large number of counterparties accepted the new price, which can support continuation.
- Information arrival. News that changes expectations often triggers both price displacement and heavier trading. Even when no discrete headline is visible, participants may respond to cumulative information such as a sector rotation, a macro data release, or technical triggers across correlated assets. Volume acts as a proxy for the breadth of this response.
- Liquidity and slippage. Thin breakouts are more susceptible to slippage and sudden reversals because the order book is not deep. Heavier volume tends to accompany deeper liquidity, which can reduce erratic whipsaws around the breakout level.
- Participation quality. Large institutions and systematic funds typically leave footprints in the form of elevated activity. Although volume does not reveal the identity of traders, clustered participation across investor types increases the chance that the move is not purely mechanical or ephemeral.
By insisting on volume confirmation, a breakout strategy attempts to filter out moves that are possible artifacts of illiquidity, late-day auctions, or temporary imbalances that resolve quickly.
Measuring Volume for Confirmation
Several practical choices arise when operationalizing volume confirmation. Each choice should be consistent with the asset class, the timeframe, and the data available.
Absolute vs. Relative Volume
Absolute volume counts the number of shares or contracts traded, but absolute figures are not comparable across instruments. Relative volume scales current activity by a baseline. Common baselines include a simple moving average of volume over a lookback window or a percentile score within that window. Relative measures allow the same logic to be applied across diverse securities.
Time-of-Day Normalization
Intraday volume is not uniform. Activity often clusters near the open and close, and around scheduled announcements. If a strategy operates on intraday bars, normalization by a typical time-of-day pattern reduces false impressions of unusual activity that are simply due to the clock. For instance, a midday bar that matches the open’s volume may be genuinely unusual, while the same volume at the open may be routine.
Multiple Bars vs. Single-Bar Spikes
Some designs require above-average volume on the breakout bar and at least one subsequent bar. The purpose is to capture not only the initial trigger but also immediate follow-through. Others treat a single, extreme spike as sufficient. Multiple-bar confirmation reduces the risk that a one-off print, a cross trade, or a closing auction dominates the signal.
Directional Volume Considerations
Because volume itself is unsigned, some practitioners enrich the measure with price information. Examples include price-volume trend, on-balance volume, and money flow indicators that incorporate the closing location within the bar. These can be used as filters to ensure that heavier activity aligned with the direction of the breakout rather than occurring primarily on opposing retracements. The added complexity should be justified by testing.
Asset-Class Specific Nuances
Equities report consolidated volume, which eases measurement. Futures volume is centralized per contract, but rolling from one contract to the next requires consistent stitching rules. Spot foreign exchange lacks centralized volume, so traders often use tick volume or futures volume as a proxy. Digital assets report volume by venue, which can vary in quality, so consolidation across reliable exchanges and filters for anomalous prints may be necessary.
Integrating Volume Confirmation into a Structured System
A repeatable breakout system with volume confirmation typically separates logic into modules: signal generation, confirmation filters, risk management, and execution. This modular structure improves clarity and auditability.
Signal Generation
The base breakout signal identifies a boundary and a breach. The boundary may be defined by recent highs, the upper edge of a volatility squeeze, or a statistically derived band. The signal module should specify how the boundary is computed, how many tests or touches define it, and what constitutes a breach. The breach definition might be intrabar or at bar close, depending on the design’s sensitivity to noise and slippage.
Volume Confirmation Filter
After a breach, the confirmation filter evaluates whether current activity meaningfully exceeds recent activity. The filter can compare current volume to a trailing baseline, to a percentile threshold, or to a time-of-day normalized profile. Some systems require that abnormal volume persists over a short window to qualify as confirmed. Others allow a brief latency, treating volume that arrives shortly after the breach as valid participation.
Contextual Filters
Additional filters often improve robustness. A common technique is to require a period of quiet trading before the breakout, sometimes called a volume dry-up. The idea is that compressed participation followed by expansion is more informative than already elevated activity that simply continues. Volatility filters can also help, for instance by focusing on breakouts that occur after a contraction rather than during an already extended surge.
Execution Considerations
Execution logic specifies how orders are placed once a breakout is confirmed. Even though this article does not provide signals, it is important to note that execution quality depends on liquidity, spreads, and queue position. Systems that require confirmation at bar close need procedures for handling late prints and closing auctions. Intraday systems must handle gaps, rapid changes in spreads, and partial fills.
Risk Management Considerations
Volume confirmation filters reduce noise but do not remove risk. Robust risk management should be embedded at both the position and portfolio levels.
Defining Risk Per Position
Conceptual stop placement often references structural elements such as the broken level, the body of the breakout bar, or an objective volatility measure. The key is internal consistency with the signal’s timeframe. Stops that are too tight relative to typical bar ranges invite frequent whipsaws. Stops that are too loose increase average loss per trade and may distort position sizing.
Position Sizing
Position sizing should align with the expected distribution of outcomes for the strategy. Many practitioners map the distance to the planned exit against a fixed risk budget per position. Volume confirmation may justify no change in risk budget on its own, since it is a filter rather than a primary driver of expectancy, but it can influence how frequently signals occur and therefore how portfolio risk accumulates.
Managing Slippage and Liquidity
Breakouts on high volume can still experience significant slippage if order books are thin or if many market participants chase the move. To obtain realistic estimates, backtests should incorporate slippage assumptions that vary with spreads, volatility, and the relative size of the order to typical traded volume. Instruments with episodic liquidity deserve particular caution around openings, closings, rebalances, and halts.
Event and Gap Risk
Scheduled events like earnings releases, economic data, or index reconstitutions can distort both price and volume. Depending on design, some systems exclude signals near such events, or they apply specific rules for gap handling and delayed confirmation after trading resumes. For instruments prone to sudden halts, a conservative approach to exposure sizing and correlation control is essential.
Portfolio-Level Controls
Breakout strategies often cluster in sectors or factors. Correlation-aware sizing and limits on aggregate exposure reduce the chance that multiple positions react the same way to a broad market shock. Daily loss limits, time-based exits for stalled trades, and rules that pause signal generation after a drawdown can help maintain stability during adverse regimes.
High-Level Example of Strategy Operation
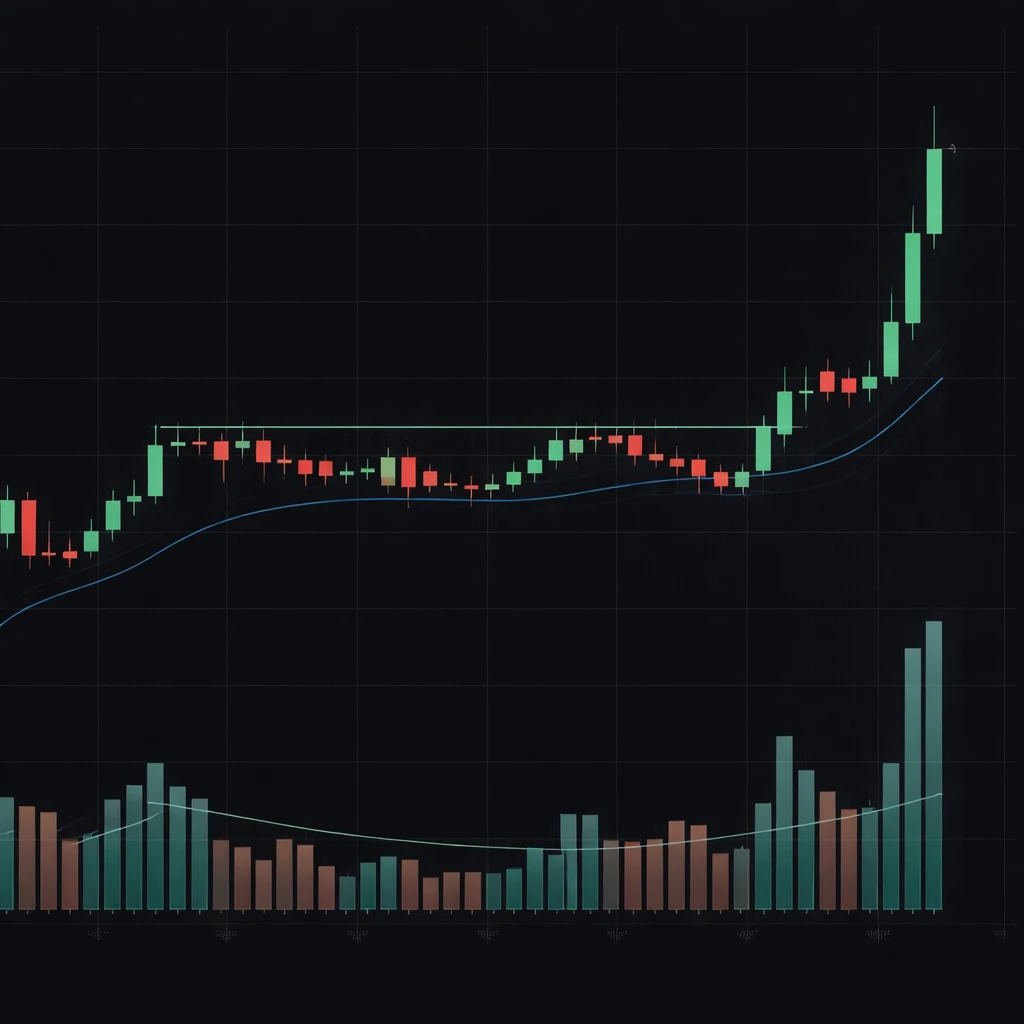
Consider a liquid equity that has traded in a relatively narrow daily range for several weeks. The range has a clear upper boundary that price has tested multiple times without sustained progress. Over this period, daily volume has gradually contracted relative to its earlier levels, reflecting reduced participation and indecision.
On a new session, price trades above the range boundary. Early in the move, volume begins to run above what is typical for that time of day. By the close, total volume is materially higher than the trailing average for the instrument. The next session opens with balanced liquidity, and follow-through buying appears. Price spends most of the session holding above the broken level. Over the first two days after the breach, volume remains elevated compared to the prior contraction phase.
In a structured system, this sequence would meet three conditions: a defined level has been exceeded, trading activity during and immediately after the breach is unusually strong, and follow-through retains a portion of that strength. The risk manager would reference the structural level of the prior range when sizing and placing protective exits, and the execution logic would account for spreads, auction prints, and any event-related anomalies around the sessions in question. No exact parameters are needed to describe the concept: the confirmation is simply the presence of greater-than-typical participation aligned with the move.
Testing and Evaluation
To determine whether volume confirmation improves a breakout framework, testing must be careful about data quality and statistical hygiene.
Data Quality
Ensure that volume data are complete and consistently defined. For equities, watch for late prints and corrections after the close. For futures, stitch contract rolls with clear rules to avoid false jumps in volume. For foreign exchange, if using tick volume or futures proxies, document the relationship to the target market and recognize its limitations.
Look-Ahead and Survivorship Bias
Do not use data that would not have been known at decision time. For example, if confirmation is evaluated at bar close, the model cannot act on that information intrabar without simulating realistic delays. Avoid survivorship bias by including delisted or inactive instruments when constructing historical universes.
Validation Approach
Segment the sample into in-sample and out-of-sample periods, and consider walk-forward procedures to tune and evaluate thresholds. Track performance across multiple market regimes. Evaluate whether volume confirmation reduces false breakouts, changes average holding time, or affects the distribution of returns.
Performance Diagnostics
Useful diagnostics include hit rate, average win and loss, risk-adjusted return measures, drawdown statistics, and maximum adverse excursion. Examine how these metrics change with and without the volume filter. A filter that reduces the number of trades but increases the stability of outcomes can be valuable even if headline returns are unchanged.
Variations and Extensions
There is no single way to implement volume confirmation. The following variations appear frequently in systematic practice.
- Dry-up and surge model. Require a period of below-typical volume preceding the breakout, followed by a material expansion on the breach. The contrast between quiet and busy phases can sharpen signal quality.
- Multi-timeframe confirmation. Confirm a breakout on one timeframe using volume trends on a higher timeframe. For example, an intraday breakout that occurs while the daily chart shows improving participation may be considered more credible than one that occurs during a daily downtrend in volume.
- Volume-weighted reference levels. Tools like anchored volume-weighted average price can show where most trading occurred. A breakout that clears a high-volume node may meet stronger resistance or support afterward than one that breaks a low-volume pocket.
- Price-volume indicators. On-balance volume, money flow, and cumulative delta in futures combine price direction with activity. They can be used as secondary filters to confirm whether heavier trading accompanied price movement in the breakout direction.
- Breadth measures. In equity indices, confirming that a substantial fraction of constituents break out with volume can mitigate the risk of index-level breakouts driven by a few large weights.
When Volume Misleads
Not all high-volume breakouts are reliable. Several situations can distort interpretation.
- Auctions and rebalances. Opening and closing auctions, as well as index reconstitutions, can produce large prints that do not reflect sustained directional conviction. Volume tied to these events may not indicate broad follow-through.
- Cross trades and block prints. Off-exchange or negotiated transactions can inflate volume without indicating genuine two-sided interest at the breakout. Filters that require persistent activity across multiple bars can mitigate this risk.
- Fragmented or synthetic volume. For markets without centralized reporting, measured activity may reflect venue-specific behaviors or wash trades. Careful venue selection and outlier filtering are important.
- News reversals. A headline can push price through a level on heavy participation, then reverse once the news is fully digested. Volume reflects interest, not necessarily agreement on direction.
Timeframe and Regime Considerations
Volume patterns vary across timeframes and regimes. Intraday systems must respect time-of-day effects and the influence of scheduled announcements. Daily systems should recognize seasonality in participation, such as diminished activity during holidays or gradual increases during earnings seasons. In risk-on regimes, breakouts may cluster with broad sector participation, while in risk-off regimes, fakeouts can increase as liquidity withdraws and spreads widen.
Governance and Documentation
Structured systems benefit from clear documentation of volume confirmation rules. Specify the baseline used for comparison, the window of time within which confirmation must occur, and how exceptions are handled. Record changes to rules and thresholds, and periodically review whether the chosen measures remain appropriate as market structure evolves. Governance practices make it easier to audit performance and diagnose periods when the filter underperforms.
Putting It All Together
Volume confirmation in breakouts is a practical way to insist on broader participation when price moves beyond a boundary. The concept does not guarantee success. It does, however, provide a repeatable lens for distinguishing between thin, easily reversed moves and those that reflect genuine engagement across market participants. When embedded in a disciplined system with careful execution and risk management, volume confirmation can improve the consistency of breakout strategies by filtering noise and highlighting moves that are more likely to find support from ongoing order flow.
Key Takeaways
- Volume confirmation compares activity during and after a breakout to a relevant baseline to gauge the breadth of participation.
- The logic rests on supply and demand imbalances, information arrival, and the relationship between participation and liquidity.
- Implementation details matter, including time-of-day normalization, multi-bar validation, and asset-class specific data handling.
- Risk management remains essential, with attention to stop placement, position sizing, event risk, slippage, and portfolio correlations.
- Testing should address data quality, avoid look-ahead bias, and evaluate whether the filter improves stability and robustness across regimes.