Breakout strategies in trending markets aim to capture the continuation phase of a trend when price escapes a clearly defined consolidation. The approach belongs to the broader family of trend-following methods, yet it concentrates on the transitional moment when balance shifts and a new impulse begins. Properly framed, this concept can be embedded within systematic rules that govern instrument selection, signal identification, risk allocation, and trade management. The result is a process that can be tested, monitored, and adapted across assets and timeframes without reliance on intuition.
What Is a Breakout in a Trending Market
A breakout is a price move out of a well-defined range or consolidation. In the context of an existing trend, the breakout occurs when price escapes that range in the same direction as the prevailing bias. The consolidation can be a horizontal range, a contracting triangle, or a sequence of narrower bars that indicates temporary equilibrium between buyers and sellers. A trending breakout does not create the trend. It seeks to rejoin a trend after a pause.
Two components are necessary. First, an objective definition of trend, such as persistent higher highs and higher lows for an uptrend, or an appropriate quantitative trend filter. Second, an objective definition of consolidation, such as a bounded price range or a volatility contraction that reflects reduced dispersion. The breakout is then the transition from contraction to expansion in line with the trend.
Why Breakouts Can Be Economically Sensible
Markets often alternate between expansion and contraction. During contraction, trading activity narrows, price compresses, and either side accumulates inventory. When price escapes that balance, the losing side may rush to exit, and the winning side may add to positions. This order flow imbalance provides fuel for directional movement. In a trending context, the path of least resistance frequently aligns with the prevailing direction, which is why continuation breakouts can exhibit favorable follow-through.
Several mechanisms are often at play:
- Auction dynamics: A range reflects temporary agreement on value. A break suggests value has shifted, prompting participants to reprice positions.
- Behavioral reinforcement: Traders who hesitated earlier may enter when price confirms a break. Short-covering or long liquidation can amplify the move.
- Volatility regime change: Compression can precede expansion. The shift in volatility can be abrupt, which benefits strategies that time transitions rather than trends continuously.
Core Elements of a Structured Breakout Approach
A breakout strategy designed for trending markets is a sequence of conditional steps. Each step should be defined in terms that can be tested and executed consistently. The following elements commonly appear in robust designs.
1. Market and Timeframe Selection
Breakouts occur across equities, futures, foreign exchange, and digital assets. Choice of market affects holding costs, position sizing, and execution. Timeframe determines how often signals appear and how long trades last. Intraday breakouts require fast execution and careful cost control. Daily or weekly breakouts trade less frequently and may better accommodate portfolio-level risk constraints.
2. Trend Identification
The strategy first establishes whether the market is trending. Methods range from simple price structure rules, such as counting higher highs and higher lows, to quantitative filters based on moving averages or slopes. The purpose is not to forecast, but to define the backdrop in which a continuation breakout is valid.
3. Consolidation Definition
Consolidation can be identified by a bounded range, by a sequence of relatively small bars, or by a decline in a volatility measure. The stricter the definition, the fewer but cleaner the opportunities. A looser definition produces more signals but may admit choppy conditions. Consistency in the definition matters more than complexity.
4. Breakout Condition
The breakout condition specifies what it means for price to leave the consolidation in the trend direction. Typical formulations require price to surpass the upper boundary in an uptrend or breach the lower boundary in a downtrend. Some designers require a closing price outside the range, others prefer an intraperiod expansion. The objective is to avoid ambiguity about whether the range was genuinely left behind.
5. Confirmation or Filters
Filters refine signal quality at the cost of fewer trades. Common filters include:
- Volume expansion: A noticeable increase in activity can signal genuine participation.
- Range expansion: A wider bar relative to recent bars can reflect a relevant volatility shift.
- Relative strength: Preference for assets outperforming a benchmark can align the strategy with stronger trends.
- Market regime filters: Excluding trades during broad risk-off conditions may reduce adverse correlation, depending on the asset class.
6. Position Sizing
Breakout strategies experience clusters of wins and clusters of whipsaws. Sizing typically references account risk limits and market volatility. Volatility-based sizing aims to equalize risk contribution across trades by scaling positions inversely with recent volatility. This can mitigate the impact of unusually large moves against the position.
7. Risk Controls and Trade Management
Every breakout can fail. A risk framework should specify where the thesis is no longer valid and how to manage the position if momentum stalls. Practitioners often combine structural references, such as the opposite side of the consolidation, with volatility-based distance. Time-based exits can remove positions that stagnate. Trailing methods attempt to harvest prolonged trends while giving the trade room to fluctuate.
Risk Management Considerations
Risk management is central to breakout strategies because false breaks are common. The aim is to keep adverse moves small relative to favorable expansions, while also controlling the cumulative risk across a portfolio.
Per-Trade Risk
Each position should have a maximum loss threshold defined in advance. The threshold can be expressed as a fraction of capital or as a scaled measure tied to recent volatility. Consistency avoids the temptation to improvise when pressure rises. The chosen distance should align with the typical noise level of the market and timeframe to reduce premature exits.
Portfolio Heat and Correlation
During strong market phases, many assets can break out simultaneously. If multiple positions share common risk drivers, portfolio drawdowns can be dominated by a single factor shock. Risk frameworks often limit total exposure by capping the sum of risk across positions, by distributing risk across sectors, or by prioritizing signals using objective criteria. Correlation estimates help prevent overconcentration.
Slippage, Gaps, and Liquidity
Breakout entries can cluster around obvious levels, which increases the risk of slippage. Illiquid instruments magnify this effect. Gaps around news or market opens can produce losses larger than planned because price jumps past intended levels. Systems that trade around scheduled events should account for this. Liquidity filters, minimum average volume requirements, and conservative slippage assumptions during testing can improve robustness.
Volatility Regimes and Whipsaw Risk
High-volatility environments often display rapid alternation between breakouts and failures. Low-volatility environments can produce slow drifts that reward patience. Designs that adapt position size to volatility may better tolerate regime shifts. Filters that require a clearer transition from contraction to expansion can reduce whipsaws, though at the cost of fewer trades.
Execution Protocols
Clear procedures for order routing, timing, and order types reduce implementation drift from the backtested plan. Intraday breakout approaches may require precise timing rules to avoid trading during the most disorderly minutes of a session. End-of-day approaches require consistent decision and execution windows to keep the live process aligned with the research assumptions.
Anatomy of a Trending Breakout
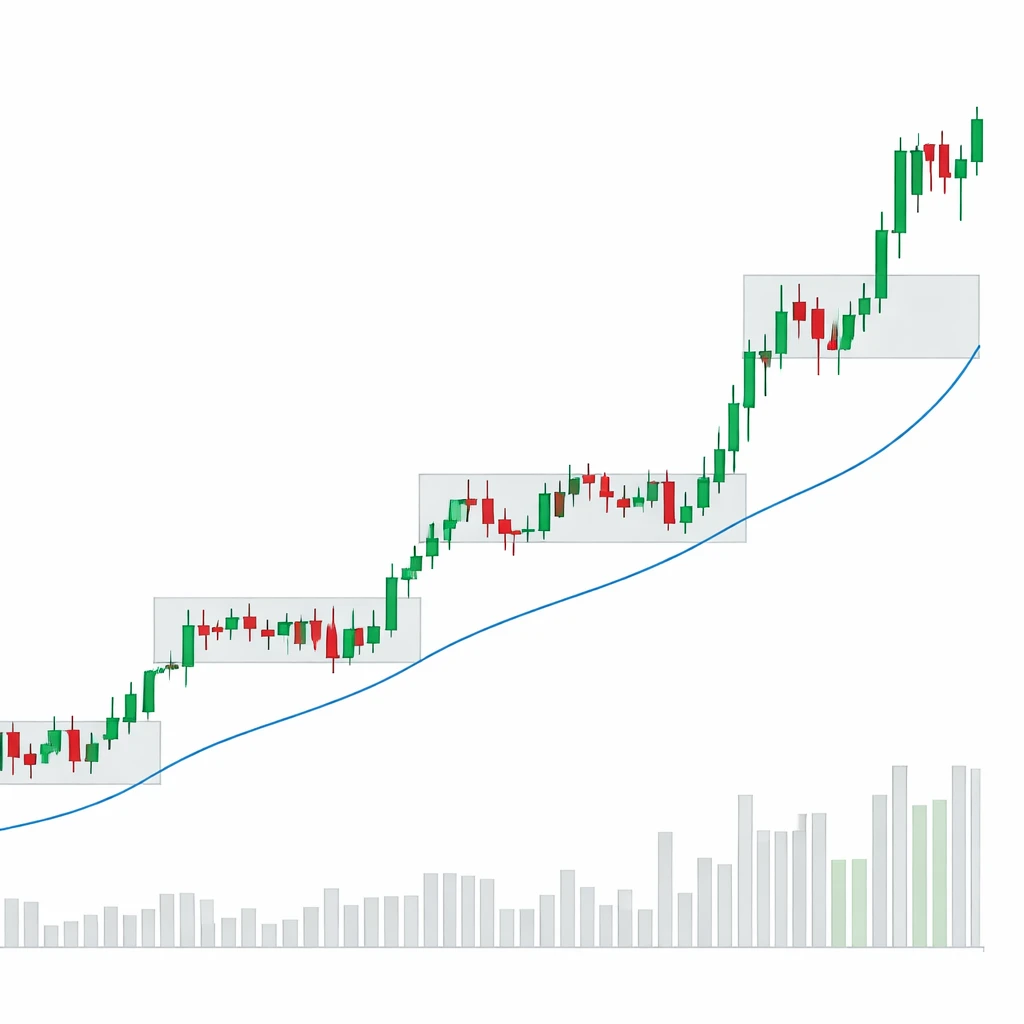
Most continuation breakouts in trends share a similar structure:
- Trend leg: A sustained move establishes directional bias.
- Pause: Price compresses into a recognizable range or volatility contraction, often on lighter participation.
- Break: Price leaves the range in the direction of the prior trend, ideally on increased participation and wider range.
- Validation or failure: After the break, price either accepts the new level and extends, or snaps back into the range, signaling failure.
Understanding this sequence helps construct unambiguous rules for identifying each phase. A strategy should specify how much evidence is required to confirm the break and how to respond if the market immediately tests the level it just left.
Fitting Breakouts into a Repeatable Trading System
Repeatability requires that the concept be translated into a small number of clear rules. The goal is not to optimize for a specific dataset. The goal is to encode a general mechanism that has economic rationale and that remains stable across moderate parameter changes. The steps below outline how a breakout concept can be integrated into a systematic process without prescribing exact signals.
Define the Universe
Choose a set of instruments with sufficient liquidity and data quality. For equities, many practitioners apply additional filters for minimum price and turnover to reduce microstructure noise. For futures and foreign exchange, contract specifications, rollover procedures, and session boundaries must be standardized before analysis.
Select the Timeframe and Sampling
Decide whether the system operates intraday, daily, or weekly. Specify the decision time, the execution window, and any rebalancing cadence. Time alignment is important, particularly if the strategy uses data such as session closes that can be revised or delayed.
Trend Filter
Implement a simple rule that classifies the market as trending upward, downward, or neutral. This can be based on price structure or on a smoothed measure of direction. The filter ensures that breakout conditions only apply when the broader backdrop is favorable to continuation.
Consolidation Detection
Classify periods of balance using a bounded range, a volatility contraction, or a pattern of reduced dispersion. Ensure the definition is insensitive to minor market noise. Fewer false positives at this stage often reduce downstream whipsaws.
Breakout Rule
Specify how price must evolve to be considered outside the consolidation in the trend direction. Many systems prefer a closing price that leaves the range to reduce intraperiod noise. Others accept an intraperiod excursion if accompanied by a qualifying expansion in range or volume. The choice should match the intended execution and the cost structure of the market.
Optional Quality Filters
Require supporting evidence such as increased participation, relative strength versus a benchmark, or a specific magnitude of range expansion. Each filter should have a clear rationale. For example, volume expansion suggests broader agreement on the new price level, while relative strength emphasizes assets that already lead their peers.
Risk Controls
Determine the invalidation level conceptually. For a continuation breakout, many practitioners reference the opposite side of the consolidation or a volatility-scaled distance. Time-based invalidation can also be used if price fails to progress after the break. These rules are not predictions. They are thresholds that separate normal fluctuation from a broken thesis.
Exit Logic
Exit rules should reflect the hypothesis. A continuation breakout assumes that price will move directionally after leaving balance. Exits can be tied to loss containment, to stalled momentum, or to an opposing signal. Trailing approaches aim to hold winners as long as the trend persists while eliminating positions that slip back into prior balance.
High-Level Example: Daily Breakout Continuation
The following example demonstrates how a trending breakout concept can operate within a structured system without specifying exact entry or exit prices.
- Universe and timeframe: Liquid instruments with sufficient daily volume, evaluated on daily data.
- Trend filter: Classify instruments as uptrend, downtrend, or neutral using a simple, objective rule based on price structure or smoothed direction.
- Consolidation: Identify a recent bounded range or a visible volatility contraction that occurs after a trend leg. The range should be well-defined, not ambiguous.
- Breakout condition: Consider a signal valid when price leaves the range in the direction of the trend and meets a minimum expansion criterion such as wider daily range relative to recent days or increased participation.
- Risk control: Define an invalidation threshold that reflects the integrity of the breakout structure, for example a retreat back through the consolidation or a volatility-scaled retracement.
- Exit: Use a combination of time-based removal if momentum fails and a trailing mechanism that follows the trend while allowing room for normal fluctuation.
- Portfolio layer: Impose a maximum aggregate risk across all open positions and consider sector or factor diversity to avoid clustering exposure.
In practice, the system cycles through instruments each day at a defined decision time, checks the trend filter, tests for consolidations, evaluates whether price action has left the defined balance, and then applies risk rules. The live process mirrors the research process to narrow the gap between backtest and reality.
Handling False Breakouts
False breakouts are a natural cost of doing business. The objective is not to avoid them entirely. The objective is to reduce their frequency and impact while keeping the door open to large continuation moves. Several design choices can help:
- Requiring acceptance: Waiting for price to demonstrate acceptance outside the range, for example by closing outside the boundary, can filter out some noise.
- Volatility-aware filters: Demanding a minimal expansion relative to recent dispersion can separate meaningful breaks from minor pokes.
- Time stops: If price fails to progress within a reasonable window after the break, closing the position can prevent capital from being trapped in stagnation.
- Correlation control: Even robust signals can fail together during broad risk episodes. Limiting aggregate exposure can mitigate the portfolio impact of a cluster of false breaks.
Evaluating a Breakout Strategy
Quantitative evaluation should extend beyond standard performance metrics to include diagnostics that match the strategy mechanics.
- Expectancy decomposition: Analyze win rate and average win relative to average loss. Breakout continuation systems often rely on a favorable payoff ratio rather than a high win rate.
- Holding period distribution: Examine how long winners and losers last. Many losers resolve quickly, while winners extend. Exit rules should reflect this asymmetry.
- Drawdown behavior: Study the depth and length of drawdowns across regimes. Correlation spikes can deepen drawdowns beyond single-name risk assumptions.
- Turnover and cost impact: Higher frequency increases sensitivity to slippage and fees. Conservative cost modeling helps avoid overestimating edge.
- Parameter stability: Vary thresholds within reasonable bounds to check that results are not overly dependent on specific parameter choices.
- Out-of-sample and walk-forward checks: Reserve data for validation and rotate calibration windows to reduce the risk of overfitting.
Adapting to Different Asset Classes
Although the concept is consistent, implementation details differ across assets.
- Equities: Overnight gaps are common. Breakouts can trigger near the market open or close. Corporate events and index rebalances can distort volume. Liquidity filters and event calendars are useful.
- Futures: Contract roll and session boundaries complicate data. Price limits can interrupt breakout sequences. Margining and leverage require strict risk caps.
- Foreign exchange: Continuous trading reduces gap risk but introduces session-specific dynamics and varying liquidity through the day.
- Digital assets: Around-the-clock trading with episodic bursts of volatility. Exchange fragmentation and varying fees affect execution quality and cost modeling.
Intraday vs. Swing Horizons
The breakout idea scales from minutes to weeks, but the trade-offs shift with horizon.
- Intraday: More signals, thinner margins per trade, higher cost sensitivity. Microstructure noise is prominent, so filters must be robust and execution precise.
- Daily and weekly: Fewer signals, wider swings, lower cost pressure relative to move size. Patience is required to avoid reacting to minor intraday fluctuations.
Practical Implementation Notes
Several operational details determine whether a backtested idea becomes a reliable live process.
- Data integrity: Use clean, survivorship-bias-free data for equities and properly back-adjusted series for futures. Time zone alignment and corporate action handling must match the intended execution rules.
- Look-ahead controls: Ensure that signals use only information available at the stated decision time. For example, systems that act on closing prices should use a consistent protocol for when those closes are considered final.
- Rebalancing cadence: Decide how often to scan for new signals and how to handle partial fills and order cancellations. Consistency limits slippage due to hesitations.
- Monitoring and review: Track live metrics against research baselines. Significant deviations can signal regime change or implementation issues.
Illustrative Walkthrough
Consider an equity that has been in a steady uptrend. Over several sessions, price compresses into a tight range with smaller daily ranges and declining participation. The system classifies the backdrop as an uptrend and flags the consolidation. A day arrives where price leaves the upper boundary of the range with a noticeably wider bar and increased participation relative to the contraction days. The system registers a breakout in the direction of the trend. A risk threshold is set conceptually against a retreat back through the consolidation area, scaled by recent volatility. If price extends, a trailing rule follows at a volatility-sensitive distance. If price stalls for a predefined number of sessions without making progress, the position is closed. All position sizes respect a portfolio-level risk cap and consider correlations with existing holdings.
This walkthrough is generic by design. It shows how the idea translates into rules without prescribing exact values. The purpose is to demonstrate the chain of logic that makes the process testable and repeatable.
Limitations and Failure Modes
Every trading concept has environments where it struggles. Breakout continuation strategies are vulnerable in mean-reverting markets where range boundaries frequently reject price. They can also suffer when the broader trend is exhausted, creating breakouts that quickly reverse. Overly aggressive confirmation rules may filter out too many trades, leaving the system underexposed during strong runs. Overly permissive rules may invite frequent whipsaws. Balance is achieved by linking rules to an explicit hypothesis about market behavior and by validating that link across diverse samples.
Integrating Breakouts into a Broader Portfolio
Breakouts can complement other strategies. For example, a trend continuation breakout module can sit alongside a slower trend-following module and a mean-reversion module, each with separate risk budgets. Diversification across timeframes and styles can smooth the equity curve, provided that dependencies are understood. Portfolio construction should consider factor exposures, sector weights, and common tail risks. The goal is not only to build strong components, but also to assemble them in a way that the whole is less volatile than the sum of parts.
Governance and Ongoing Research
Systematic methods benefit from clear governance. Document definitions, data sources, and execution protocols. Establish thresholds that trigger review, such as extended underperformance or a sudden jump in slippage. Consider stress tests that simulate extreme conditions, including large gaps, halted trading, or severe liquidity droughts. Continuous research can explore parameter robustness, new filters with economic rationale, and alternative exit structures, but changes should be introduced with caution and validated out of sample before adoption.
Concluding Perspective
Breakouts in trending markets offer a disciplined way to participate in continuation moves without forecasting turning points. The edge, if any, comes from the consistent application of a simple hypothesis supported by market mechanics. By defining trend, identifying consolidations, waiting for a clear exit from balance, and enforcing strict risk controls, a trader can build a repeatable process that is open to meaningful expansions and resilient to inevitable failures. The focus remains on structure, not prediction, and on process quality, not isolated outcomes.
Key Takeaways
- Breakouts in trends target the transition from consolidation to expansion in the direction of the prevailing move.
- Clarity in defining trend, consolidation, and breakout conditions is essential for a testable and repeatable system.
- Risk management dominates outcomes due to the prevalence of false breaks and correlation clusters.
- Filters such as volume expansion, range expansion, and relative strength can improve signal quality at the cost of fewer trades.
- Robust evaluation includes expectancy, drawdowns, turnover, parameter stability, and out-of-sample validation.