Breakouts from consolidation are a family of strategies built around a simple observation: markets alternate between quiet periods of balance and active periods of repricing. Consolidation compresses price and volatility as buying and selling pressure come into near equilibrium. A breakout occurs when price escapes that balance and begins to travel with momentum, often accompanied by an expansion in volatility and participation. The strategy does not rely on prediction. It seeks to codify a recurring market behavior and to manage the risk around that behavior in a systematic way.
Definition and Scope
A consolidation is a relatively stable price region where swings narrow and trend progression pauses. Market participants absorb information and clear orders within a bounded range. A breakout is the first decisive move outside that region, sustained long enough to indicate that the balance has shifted. The strategy can be applied across instruments and timeframes, including equities, futures, foreign exchange, and digital assets, from intraday intervals to weekly bars.
Within a structured system, the concept is implemented with three pillars:
- Objective identification of consolidation conditions.
- Objective criteria for what constitutes a breakout.
- Controls to manage downside variability and adverse scenarios.
The details of implementation vary by market microstructure and trading horizon, but the core logic remains consistent: position risk is taken when the market transitions from compression to expansion, with exits governed by predefined rules rather than discretion.
Core Logic of Consolidation and Breakout
Supply, Demand, and Order Placement
Consolidation reflects a temporary balance between supply and demand. Participants agree on a fair region, often clustering resting orders near the boundaries of the range. In many markets, liquidity providers and passive orders concentrate near the recent highs and lows of the consolidation, while protective stop orders accumulate just outside those levels. When incoming market orders or news flow push price beyond a boundary, it can trigger a cascade of activity: stops are executed, passive liquidity thins, and momentum traders engage. This chain reaction helps explain why breakout moves can be swift relative to the preceding quiet period.
Volatility Contraction and Regime Shift
Volatility often contracts during consolidation as realized ranges tighten. When price breaks out, volatility typically expands toward a new regime as uncertainty about the new equilibrium is resolved through trading. The strategy’s edge is a timing edge rather than a forecasting edge. It tries to enter when the odds of sustained travel are higher because the market has moved from low dispersion to high dispersion. There is no guarantee that the new regime will last. False breakouts occur when price quickly returns to the prior range. A well-designed system accepts this possibility and contains the loss when it happens.
Identifying Consolidation
Price Structure
Consolidations can be visualized as narrow rectangles, short-term channels, or symmetrical patterns such as small triangles. The specific geometry is less important than the underlying characteristics: price oscillates within a confined band, swing highs and lows compress toward a midpoint, and net trend progression slows or stalls. Traders often label these as ranges or bases. A systematic approach translates these ideas into rules that do not rely on visual interpretation.
Volatility Measures
Quantifying consolidation typically involves statistics of range and dispersion. Common building blocks include measures of average true range, rolling standard deviation of returns, or percentile ranks of recent volatility compared with a longer baseline. Consolidation is present when these metrics fall below a predefined threshold and remain depressed for a minimum duration. This avoids labeling a single quiet bar as a genuine base.
Time Compression and Stability
Consolidation is stronger when it persists. A few consecutive quiet intervals may simply reflect a pause within an ongoing trend, while a longer plateau can indicate deeper agreement among participants. Systems often require a minimum number of observations inside a narrow band, a limit on the total drift within that band, and guardrails against excessive overlap with major news events or illiquid sessions.
What Constitutes a Breakout
Directionality and Confirmation
A breakout is the first credible move beyond the consolidation boundaries. Direction is defined relative to the established range. Long-side breakouts occur above the upper boundary, while short-side breakouts occur below the lower boundary. Confirmation can be encoded with persistence conditions, such as staying beyond the boundary for a minimum time or distance, or closing outside the band rather than merely printing a transient tick.
Volume and Liquidity Context
Participation often increases when a true breakout takes hold. Volume surges can indicate that the move is attracting attention and that orders are being executed. In liquid markets, a broadening of the depth of book and tighter spreads after the break may support continuation. In thin markets, spreads can widen and slippage can be material. A robust system accounts for liquidity differences and adapts filters accordingly.
Placing Breakouts within a Repeatable Trading System
A breakout idea becomes a strategy when embedded in a process with explicit rules for data handling, signal generation, sizing, execution, and review. A system should be specific enough to be testable and repeatable, and general enough to avoid optimization to idiosyncrasies of a single dataset.
- Universe selection. Define the instruments that are eligible based on liquidity, tradability, corporate actions, and data quality.
- Timeframe alignment. Shorter horizons respond quickly to new information but are more sensitive to noise and costs. Longer horizons smooth noise but respond slowly and may carry gap risk across sessions.
- Parameter discipline. Rules for consolidation and breakouts require thresholds. Stability across neighboring threshold values is more important than precision at a single value. The goal is robustness rather than a peak backtest result.
- Process governance. Codify procedures for research, deployment, monitoring, and decommissioning. Document changes and preserve out-of-sample tests.
Risk Management Considerations
Risk Budgeting and Position Sizing
Position sizing translates market risk into portfolio risk. Systems commonly size positions relative to account equity, recent volatility, or a combination of both. Tying size to realized volatility tends to align risk across trades. For example, a more volatile instrument receives a smaller notional allocation than a less volatile one, holding expected risk near a target. Concentration limits at the instrument and sector level guard against clustering of similar exposures.
Defining Adverse Scenarios
Breakout strategies experience two primary adverse scenarios. The first is a false break where price returns to the consolidation region shortly after the breakout. The second is a partial follow-through that stalls and reverses before reaching the intended exit criteria. The system should define how losses are contained in both cases. Common approaches include stops beyond structural levels, time-based exits if momentum fails to develop, or volatility-based exits that respond to sharp expansions against the position.
Gap, Slippage, and Liquidity Risk
Breakouts frequently coincide with an increase in trading activity. Executions near the boundary can suffer from slippage if many participants attempt to transact at the same time. Overnight gaps and event-driven repricing can move price past contingent orders. Risk protocols should acknowledge these realities. That can include using liquidity filters, limiting trades around scheduled announcements, or modeling expected slippage in position sizing so that realized risk does not exceed design assumptions.
Volatility Regime Awareness
Breakout performance depends on the background regime. During high-volatility bear cycles, breakouts may overshoot and reverse violently. During low-volatility bull cycles, breakouts may be cleaner but shallower. Regime filters do not need to be predictive. They can be descriptive, such as only operating when broad market volatility sits within a defined band, or changing size multipliers across regimes to normalize portfolio risk.
Portfolio-Level Controls
When applied across multiple instruments, the strategy can accumulate correlated risk. Exposure limits by direction, sector, or factor reduce the chance that many trades fail simultaneously. Diversifying across timeframes can also smooth equity curves, as short-horizon signals will not always align with longer-horizon signals. A maximum portfolio drawdown threshold, if reached, can trigger a preplanned reduction in activity while diagnostics are reviewed.
Execution Mechanics
Order Types and Microstructure
The choice of order type affects slippage, fill probability, and signaling risk. Aggressive orders prioritize immediacy but pay the spread and potential impact. Passive orders provide liquidity but risk missing the move. Some systems mix approaches, becoming aggressive when persistence conditions are met and more passive during setup formation. Microstructure details matter. Equities may fragment liquidity across venues. Futures concentrate liquidity in a single central limit order book. Foreign exchange involves dealer quotes and differing tick sizes. The execution layer should be consistent with the backtest assumptions used in research.
Monitoring and Process Control
Automated alerts or execution can help keep behavior consistent. Regardless of automation, logs of fills, slippage, and rejects provide feedback that informs parameter tuning. Latency, partial fills, and rejected orders all affect realized outcomes. A system should record these operational variables so that paper assumptions can be reconciled with live results.
High-Level Example of Operation
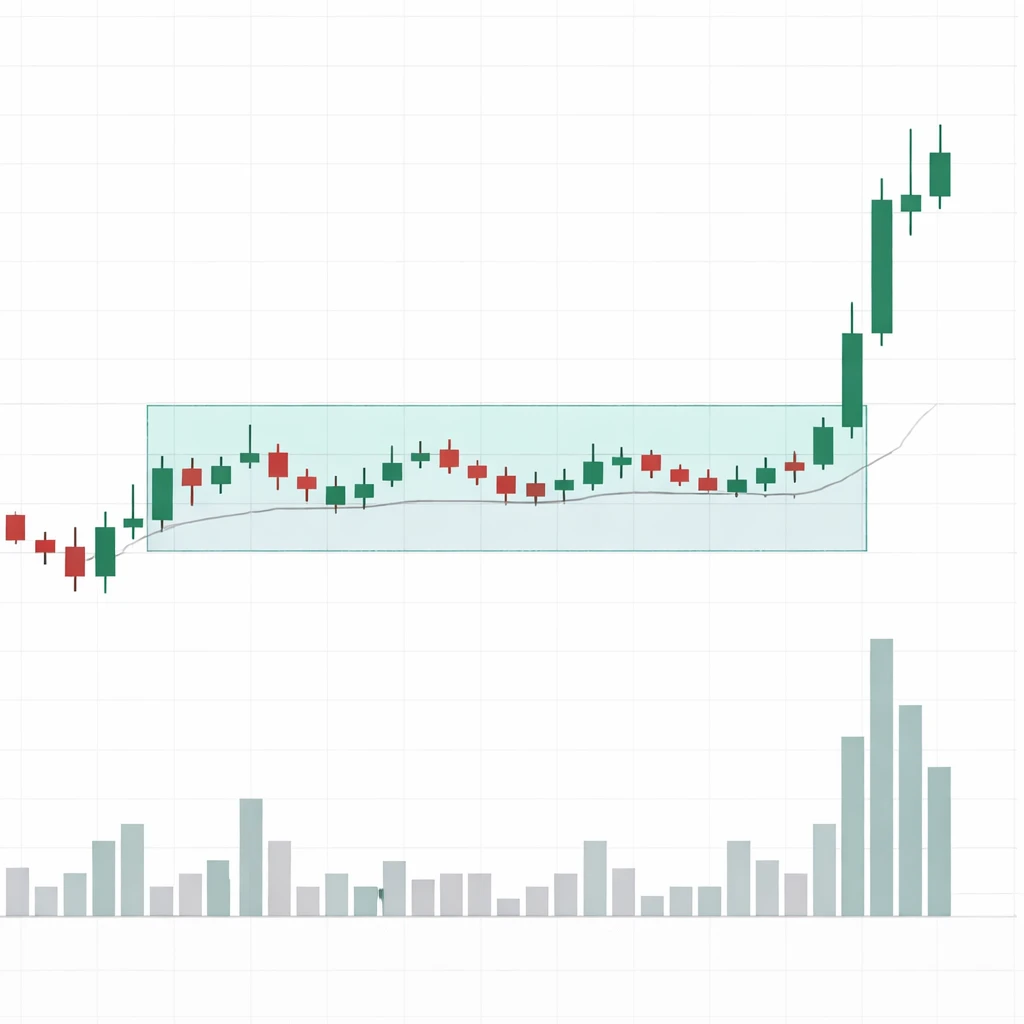
Consider an equity that trades for several weeks within a relatively tight range. Daily highs and lows drift closer together over time, and a rolling measure of average range declines compared with its long-term baseline. Volume remains near average, with occasional spikes that fade quickly. The broader market is stable, and there are no scheduled earnings within the immediate horizon.
A rule-based strategy might recognize that the stock has met its consolidation criteria: volatility percentile below a threshold and at least a minimum number of sessions contained within a narrow band. The system defines boundaries around the recent highs and lows and specifies what counts as a credible break. No prices are predicted. The strategy waits for evidence that the balance has shifted.
On a particular session, the stock opens within the range. Midday, flows accelerate and price travels above the upper boundary. The system checks for persistence, such as whether price remains beyond the level for a minimum interval or whether the close of the bar sits above the band. Relative volume climbs in parallel. With conditions satisfied, the system signals that a breakout is in progress.
Risk is sized using a volatility-based method. The system sets an initial protective level that would indicate failure if reached, such as a point beyond the opposite side of the consolidation or a multiple of recent range against the position. The distance between entry and the protective level defines the position size given a fixed risk budget. Execution seeks liquidity while acknowledging that some slippage is likely during the break.
After entry, management follows rules that were established in research. If price extends favorably, a trailing exit may move in the direction of the trade at a controlled pace, for example by following a volatility measure or a structural level. If momentum fails to develop within a predefined window, the position can be reduced or closed to avoid capital being tied up in a stalled scenario. If a sharp reversal returns price to the interior of the prior range, the protective level is triggered, and the loss is contained by the initial risk budget. At no point does the operator need to intervene subjectively. The process is designed to be repeatable across many occurrences of the same pattern.
Variations and Filters
Breakout from consolidation is a broad category. Variations arise from how consolidation is measured, how a valid break is confirmed, and how exits are governed. Below are common variants used in research and practice.
- Structure-driven consolidations. Rectangles, flags, and triangles represent different arrangements of the same idea. Flags include a slight counter-trend drift within the consolidation. Triangles compress with converging trendlines. A rules-based system translates these geometries into range and slope criteria rather than visual drawing.
- Retest preference. Some systems favor a retest of the breakout level, requiring price to return toward the boundary and hold before continuation. This can reduce slippage at the cost of missed moves.
- Session and time-of-day filters. Intraday systems may require that breaks occur during the most liquid hours for the instrument to reduce adverse selection. Overnight gaps can be treated separately with dedicated logic.
- Multi-timeframe alignment. A short-term breakout that aligns with a longer-term uptrend can have different statistical properties than one that opposes it. Alignment can be implemented with a higher-timeframe trend filter.
- Event filters. Scheduled events, such as earnings reports or economic releases, can inject discontinuities into price. Systems may suspend breakout logic within a window around these events or adjust risk size to reflect the additional uncertainty.
Testing and Evaluation
Data Integrity and Bias Control
Backtests require clean data. Corporate actions, survivorship bias, look-ahead bias, and timezone alignment can all distort results. Research should use a survivorship-bias-free universe and adjust historical prices for splits and dividends where appropriate. Indicators must be computed using only information available at the time of decision.
Out-of-Sample Validation
A credible strategy shows stability outside the period used for design. Common approaches include walk-forward testing, where parameters are fixed on a training window and then applied to a subsequent unseen window, and k-fold cross-validation for parameter robustness. Parameter sweeps should reveal plateaus of acceptable performance rather than a single sharp optimum. Sharp optima are fragile.
Metrics Beyond Win Rate
Breakout strategies often have a modest win rate paired with asymmetric payoffs. The expectancy of a system depends on both the win rate and the ratio of average win to average loss. Evaluation should also consider drawdown depth and duration, turnover, capacity, and the sensitivity of outcomes to slippage. Regime analysis helps identify when the strategy is most and least effective. Stability across instruments and timeframes strengthens the case for deployability.
Common Pitfalls and How Systems Address Them
Many difficulties with breakout strategies originate from two sources: unrealistic assumptions about execution and overfitting to historical patterns.
- Over-optimization. Tuning thresholds to maximize historical profits produces fragile rules. Robust systems use simple measures, conservative assumptions, and confirm that small parameter changes do not degrade results materially.
- Ignoring costs and market impact. Breakouts can be crowded. Backtests that ignore spread, fees, and slippage overstate performance. Cost modeling should be embedded directly in research and reflected in position sizing.
- Misclassifying consolidations. Short pauses within strong trends may not represent true balance. Using duration and volatility compression filters helps distinguish brief pauses from genuine bases.
- Trading illiquid instruments. Thin liquidity increases slippage and gap risk. Liquidity screens and minimum volume criteria reduce operational risk.
- Regime blindness. A single set of rules may behave differently across regimes. Documented adjustments for high and low volatility environments can stabilize the realized equity curve.
Practical Integration into a Portfolio Process
Integrating a breakout strategy into a broader portfolio involves matching its profile with existing exposures. If the portfolio already holds trend-following components, a consolidation breakout may overlap in behavior. If the portfolio is dominated by mean-reversion tactics, breakouts can diversify return sources. Portfolio construction does not rely on correlation alone. It also considers turnover, holding period, capacity, and the capital at risk during market stress. Routine stress tests, such as shocks to volatility and liquidity, help identify concentration.
Operations matter. Clearly defined checklists for data validation, daily system health, and post-trade reconciliation reduce the chance of drift between design and execution. A cadence for performance reviews supports timely detection of changes in market structure that might impair the edge of the strategy.
Ethics, Compliance, and Data Use
Systematic strategies depend on data. Data should be sourced and used in compliance with licensing terms. If alternative data are incorporated to enrich consolidation detection or breakout confirmation, their provenance, timeliness, and potential biases require explicit assessment. Documentation and audit trails support transparency and replicability.
Key Takeaways
- Breakouts from consolidation formalize the transition from low-volatility balance to directional movement, relying on timing rather than prediction.
- Objective rules for identifying consolidation, defining a credible breakout, and managing risk convert a pattern into a repeatable system.
- Risk management focuses on sizing by volatility, containing false breaks, and accounting for gaps, slippage, and liquidity.
- Performance depends on market regime, execution quality, and robustness to parameter changes, not on a specific geometric pattern.
- Thorough testing with clean data, out-of-sample validation, and realistic cost modeling is essential before integrating the strategy into a portfolio.