Introduction: Defining Trading Volume
Trading volume is the total quantity of a financial instrument exchanged during a specified period. On a chart, that period could be a minute, an hour, a day, or any other interval the analyst selects. The unit depends on the market. For equities, volume is typically reported in shares. For futures, it is contracts. For exchange-traded funds, it is ETF shares. For options, it is option contracts. In spot foreign exchange, centralized volume is not available, so analysts often use broker-reported tick volume, which counts price changes as a proxy for activity. In cryptocurrency, each exchange reports its own volume and aggregation practices vary.
Volume is a measure of activity rather than price direction. A large number of shares can trade while price moves only slightly if buy and sell orders match at similar prices. Conversely, price can move sharply on low volume if the available liquidity is thin. Technical analysts study volume because it conveys information about participation, liquidity, and the intensity of price discovery. It helps answer questions such as: How many market participants took part in this move? Was the price change driven by a small group or broad engagement? Did activity cluster around certain prices or times of day?
How Volume Is Measured Across Markets
Equities
Equity volume counts the number of shares changing hands during a period. In many jurisdictions, volume includes on-exchange trades and off-exchange prints reported to trade reporting facilities. Data vendors typically consolidate these sources. Historic complications include odd-lot reporting and differences among venues, but modern consolidated feeds cover the majority of activity. Corporate actions such as stock splits are usually adjusted in historical data so that pre-split volume is scaled for comparability.
Futures
Futures volume is the number of contracts traded within the period. It is distinct from open interest. Volume tallies turnover; open interest measures the number of outstanding contracts at the end of the day. High volume with falling open interest can indicate many intraday trades that close before the session ends. Futures markets also roll from one contract month to the next, which shifts volume from the expiring contract into the next active one. Analysts often examine a continuous contract that stitches together active months to maintain a coherent chart, while being mindful that roll periods alter volume patterns.
Foreign Exchange and Crypto
Spot foreign exchange has no single centralized exchange. As a result, there is no complete consolidated volume figure. Many platforms display tick volume, which counts the number of price updates during the bar, or broker-specific trade counts. This does not equal the true number of currency units transacted across the interbank market. Still, tick volume correlates reasonably with periods of high activity and can be used directionally for relative comparisons within the same data source.
Cryptocurrency volume differs by exchange. Aggregated feeds sum across venues, but coverage varies and wash trading has been a topic of scrutiny in some venues. On-chain measures such as transfer volume are not the same as exchange trading volume. When comparing volume across cryptocurrencies or exchanges, the data source and methodology matter.
Options
Options volume counts contracts traded. Because options are derivatives of an underlying instrument and their contracts represent different strikes and expirations, comparing raw volume across options is not straightforward. Analysts sometimes use option volume alongside open interest, implied volatility, and put-call ratios to understand how options markets reflect demand for hedging or speculation. These are distinct from underlying share volume and should not be conflated.
How Volume Appears on Charts
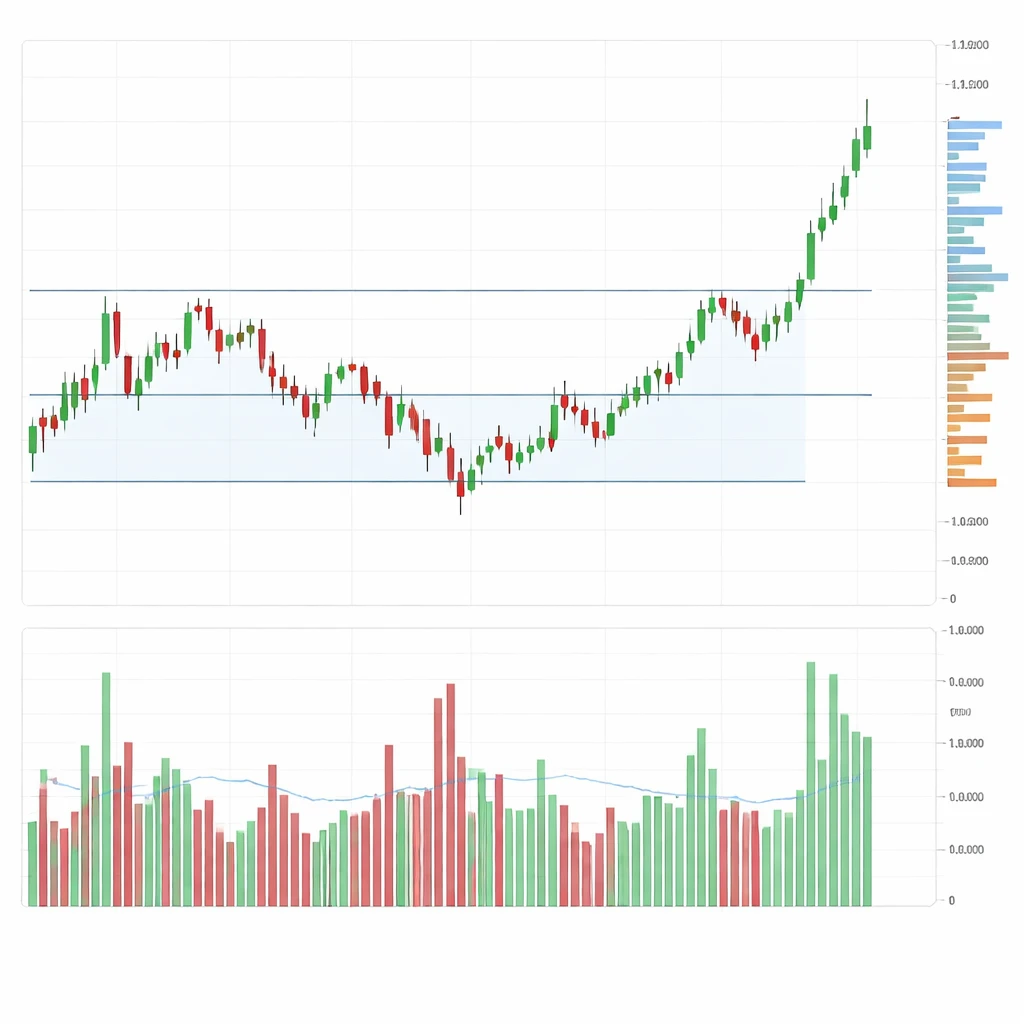
On most charting platforms, volume appears as a histogram at the bottom of the chart. Each bar corresponds to the chart’s time interval and the height represents the total units traded during that interval. Many platforms color the volume bar using the price bar’s direction for that period. An up-close in price produces a green or light-colored volume bar. A down-close produces a red or dark-colored volume bar. This convention makes it easier to scan whether activity skewed toward periods that closed higher or lower, though it does not reveal the exact breakdown of aggressive buys versus sells within the bar.
Analysts often overlay a moving average on the volume histogram to establish a baseline. For example, a 20-period volume moving average on a daily chart highlights whether today’s activity is above or below typical recent levels. Relative volume metrics scale the current bar’s volume by the average volume for comparable times of day or recent periods. A relative volume of 2.0 on an intraday bar indicates the bar’s volume is roughly double its usual level for that time block.
Another way volume appears is as volume-by-price, sometimes called a volume profile. This is a horizontal histogram drawn alongside the price axis, showing how much volume traded at each price level over a selected window. Volume-by-price helps identify prices where substantial two-way trade occurred and prices with thin participation. The profile does not indicate time spent, only the concentration of volume at prices.
Some charts display cumulative volume indicators. On-balance volume and accumulation-distribution lines, for instance, combine price direction and volume into a running total or weighted measure. While such indicators can be useful for summarizing information, they are derivative constructs. The raw histogram and the price-by-price distribution remain the primary windows into volume itself.
Why Analysts Pay Attention to Volume
Volume provides context for price movement. Price alone tells you what changed. Volume helps gauge how many participants contributed and whether liquidity was abundant or scarce. Analysts use volume to assess several aspects of market behavior.
Liquidity and Execution Conditions
Higher volume often coincides with tighter quoted spreads and deeper order books, which can facilitate trade execution. When volume is low, quotes can be thin and price can move more in response to individual orders. This is not a directional statement. It is a microstructure observation that relates the pace of trading to the depth of the market available at each price.
Participation and Conviction
Substantial price movement on unusually high volume indicates broad participation in the process of price discovery. Analysts sometimes interpret that as strong interest in the new price level, whether motivated by information, rebalancing, or liquidity needs. Conversely, price changes on very low volume are sometimes viewed as less representative of the wider market. The same price change achieved on larger volume suggests a larger set of transactors accepted or initiated those trades.
Relationship with Volatility
Volume and volatility are related but not identical. In many markets, realized volatility tends to be higher during periods of elevated trading activity. More trades mean more opportunities for order imbalances to move price, and active information arrival can prompt both volume and volatility to rise together. That said, there are days with high volume and modest net price change if buyers and sellers are highly matched. There are also days with large price moves on modest volume when liquidity is thin. Volume gives a partial view of the environment that, combined with price ranges, clarifies how aggressively markets are repricing.
Price Discovery, Confirmation, and Exhaustion
Analysts often look for volume to confirm the significance of a price move or to reveal potential exhaustion. A sharp break from a long consolidation on large volume indicates that many participants transacted at new prices, which can signal a broad update to consensus value. Conversely, a rapid price move that occurs late in the day on dwindling volume can sometimes mark a short-term exhaustion of activity. These are contextual judgments rather than mechanical rules. The aim is to align price change with the level of participation that produced it.
Interpreting Volume in Context
Time-of-Day Patterns
Intraday volume is not uniformly distributed. In equity markets, the first and last 30 minutes of the regular session often carry a disproportionate share of daily volume. The open sees overnight information incorporated into prices and the close concentrates rebalancing and benchmark tracking flows. Midday volume tends to be quieter. An intraday chart that shows a large early spike followed by tapering volume may reflect this natural rhythm rather than a change in conviction.
Calendar Effects
Volume often declines around market holidays and can rise around month-end, quarter-end, and index rebalancing dates. Corporate earnings seasons also concentrate volume in firms reporting results. Seasonal effects vary by market and region, so comparisons are most meaningful within the same instrument and similar calendar conditions.
News and Events
Economic releases, policy announcements, and company-specific news can drive simultaneous increases in volume and volatility. Before scheduled events, volume may temporarily decrease as participants wait for information. After the release, volume can surge as orders interact at new prices. When examining volume around events, the reference baseline matters. Comparing to a multi-day average smooths one-off spikes and gives a clearer sense of what is unusual.
Indexing and ETF Mechanics
Index reconstitutions and ETF creations or redemptions can affect underlying security volume. For example, when an ETF experiences net inflows that require underlying share purchases, its component stocks may show elevated volume. In such cases, increased activity reflects portfolio mechanics rather than entirely new information about fundamental value. Context about the source of flow helps prevent overinterpretation.
Contract Roll in Futures
As futures contracts approach expiration, volume migrates from the expiring contract into the next active month. Comparing volume across the roll without accounting for this shift can be misleading. Many charting packages manage continuous contracts, but it is still useful to note roll dates when evaluating apparent changes in activity levels.
Practical Chart-Based Examples
Example 1: Breakout From a Prolonged Range
Consider a daily chart of a stock that has traded between 48 and 52 for three months. Over this period, the volume histogram shows a declining 20-day volume moving average. The volume-by-price profile indicates heavy volume around 50, suggesting that a large amount of two-way trade occurred at that level. On day 65, the stock closes at 53.20, clearly above the upper boundary. The volume bar for that day is the largest in six months and sits far above the moving average. The next day shows continued trading above 52 with volume still above average but lower than the breakout day.
What does the combination communicate? The extended period of balance featured waning participation. The break above the range occurred with a notable expansion in volume. That indicates that the re-pricing attracted a wider set of transactors and that liquidity was consumed at higher prices. The subsequent modest reduction in volume following the initial spike is common as the market digests the move. None of this predicts future direction. It frames the significance of the change and the breadth of participation that accompanied it.
Example 2: Earnings Day Intraday Structure
On a 5-minute chart for a company reporting before the open, the first bar prints a gap up from the prior close, followed by a wide candle with very high volume. The next hour shows smaller price bars and a steady decline in per-bar volume as the market consolidates the initial reaction. Near midday, a second upward push occurs with a renewed increase in volume, though not as high as the opening burst. Into the close, volume rises again as benchmark and risk controls drive end-of-day flows.
In this pattern, the opening volume surge reflects the release of pent-up orders reacting to new information. The midday taper is consistent with intraday seasonality and digestion of the initial move. The later session lift in both price and volume suggests continued interest at the new levels, while the closing rotation brings mechanical volume unrelated to discretionary views. Reading volume alongside price in this way separates informational surges from routine flows and helps judge how activity evolved throughout the session.
Example 3: Low-Volume Pullback Within a Trend
Suppose an index future has advanced for several weeks with a rising 10-day average of daily volume. After a recent high, it retraces for three sessions. Price declines are modest in range and daily volume falls below the 10-day average. On the fourth day, the market stabilizes with a smaller range and volume remains subdued.
This configuration often occurs when a market pauses after a directional phase. The reduced volume during the pullback indicates that fewer participants engaged in transacting at the lower prices relative to the prior advance. Whether the trend resumes or not is a separate question. The key observation is that the counter-move took place without a surge in activity, which can color how an analyst interprets the pullback’s informational content.
Common Data and Interpretation Pitfalls
Fragmented Reporting and Dark Venues
Not all volume prints appear identically across data providers. Equity markets route orders across multiple venues, including off-exchange facilities. While consolidated feeds capture most activity, the timing and classification of prints can vary. When precision matters, reviewing the data vendor’s methodology helps. For cross-market comparisons, reliance on a single consistent data source reduces apples-to-oranges issues.
Tick Volume vs Actual Volume in FX
Tick volume can be a useful proxy for activity in foreign exchange, but it is not the same as counting currency units transacted across the market. Comparing tick volume across different brokers is problematic because it depends on the platform’s price update frequency and liquidity relationships. Use tick volume as a relative measure within one data set rather than as an absolute cross-source metric.
After-Hours and Pre-Market Inclusion
Some platforms include pre-market and after-hours trades in the daily volume total. Others report only regular-session volume. Intraday charts may blend sessions. When comparing volume across days or instruments, confirm whether off-hours trading is included. Differences in session definitions can lead to misinterpretation.
Corporate Actions and Adjustments
Stock splits and reverse splits require volume adjustments in historical data to maintain continuity. If a historical series is not adjusted, average volume and relative comparisons around the split date can appear distorted. Most professional datasets provide split-adjusted volume series. It is still prudent to verify adjustments when large step changes appear in the history.
Confusing Volume with Open Interest
In futures and options, volume is the tally of contracts traded within the period. Open interest is the number of contracts outstanding at the end of the session. They are related but distinct. A day can have high volume and declining open interest if many positions are opened and closed within the same session. Conflating the two can lead to incorrect conclusions about participation and positioning.
Raw Volume vs Dollar Volume
A stock with a price of 10 trading 10 million shares has the same share volume as a stock at 100 trading 10 million shares, but it does not represent the same dollar turnover. Some analysts use dollar volume, which multiplies price by volume, to compare trading activity across securities with very different prices. The choice of metric should match the analytical question being asked.
Volume and Volatility: A Closer Look
From a statistical perspective, volume and volatility often move together because both respond to the arrival of information and shifts in liquidity. When new information changes expectations about value, more traders enter the market to update positions, which increases trading frequency and can widen daily price ranges. Microstructure models formalize this intuition. Order flow imbalances, even in deep markets, can have price impact that scales with liquidity. When depth is high and orders are balanced, price can absorb more volume with smaller moves. When depth is thin or one side is more aggressive, similar volume can result in larger moves.
This relationship is not linear and not stable across all conditions. At times, volume can be elevated because two-way trade is heavy around a fair value area, which can compress realized volatility. At other times, volume stays low while volatility rises because quotes widen and liquidity providers withdraw, allowing relatively small trades to move price. Reading volume alongside measures of realized volatility, such as average true range or intraday range statistics, can provide a fuller picture of the current regime without asserting a deterministic link between the two.
Useful Companion Metrics
Several basic metrics help standardize volume analysis across instruments and time.
- Average daily volume. The mean or median of daily volume over a lookback window. Often used as a baseline to determine whether current activity is typical or unusual.
- Relative volume. The ratio of current volume to its average over a comparable period. On intraday charts, some platforms compute relative volume for each time slice compared with its usual activity at that time of day.
- Turnover and float turnover. Turnover expresses volume as a fraction of shares outstanding. Float turnover uses the free float. A day with 20 percent float turnover indicates that volume equaled 20 percent of the shares freely available to trade. This contextualizes activity relative to the supply of shares.
- Dollar volume. Price multiplied by units traded. Useful when comparing activity across instruments with very different prices.
- Volume moving averages and ranges. Moving averages smooth erratic day-to-day changes. Analysts may also track the distribution of volume over a lookback window to see how often volume exceeds certain thresholds.
These tools do not prescribe action. They anchor judgments about what constitutes normal versus unusual activity and help analysts avoid overemphasizing routine fluctuations.
Putting Volume Into Analytical Practice
Volume is most informative when interpreted with price structure, time, and event context. A chart that combines price bars, a volume histogram with a moving average, and if appropriate a volume-by-price profile, offers a multi-dimensional view of how the market has engaged. The analyst can ask: Where did substantial two-way trade take place. How did activity evolve during the day. Did a major move attract or repel participation. Are we observing a seasonal or mechanical pattern that explains the change in activity. None of these questions assumes a trading decision. They serve to improve reading of market behavior.
It is important to remember that volume does not issue clear-cut signals in isolation. A large spike can accompany both continuation and reversal outcomes because volume measures engagement, not direction. Low volume does not guarantee calm. It can coincide with sharp moves if liquidity thins. As with any technical input, volume adds value when anchored to specific hypotheses about what the market is doing, then tested against the evidence on the chart and the surrounding context.
Key Takeaways
- Trading volume measures how many units of an instrument change hands in a given period and is a primary gauge of market activity, not direction.
- On charts, volume typically appears as a histogram by time and can also be shown as a horizontal volume-by-price distribution to reveal activity by level.
- Analysts watch volume to assess participation, liquidity conditions, and how strongly the market engaged with recent price changes.
- Volume and volatility often rise together around information events, but the relationship depends on liquidity and order balance, so it is not deterministic.
- Context matters. Time of day, calendar effects, data sources, and market structure all influence how volume should be interpreted on any given chart.