Volume is a fundamental dimension of market activity. It records how many shares, contracts, or units change hands over a defined interval. When analysts speak about volume in trend confirmation, they refer to the relationship between price direction and the intensity of participation. In simple terms, a trend that progresses on relatively higher volume is viewed as more broadly supported than one that advances on thin activity. Conversely, a trend that weakens while volume expands can indicate a shift in participation against the prevailing direction.
The idea is not mechanical. Volume does not cause price to move, and price can rise or fall for extended periods with shifting levels of activity. Yet, across many liquid markets and timeframes, volume helps contextualize whether a move is attracting or losing attention. This article outlines a precise definition, shows how volume patterns appear on charts, discusses why they matter to market interpretation, and provides practical chart-based context without prescribing strategies or recommendations.
Defining Volume in Trend Confirmation
Volume in trend confirmation is the observation that a price trend gains credibility when moves in the direction of the trend occur with relatively elevated volume, while countertrend moves often occur with relatively reduced volume. The focus is on relative comparisons rather than absolute thresholds. Volume is evaluated against a baseline such as a recent moving average of daily volume, intraday benchmarks, or a statistical normalization of recent activity.
Two elements sit at the core of the definition:
- Directional alignment: Price movement that aligns with the trend is examined for volume expansion relative to recent periods.
- Countertrend moderation: Pullbacks or reactions against the trend are examined for lighter volume relative to trend days.
When the first element dominates the second, analysts often describe the trend as confirmed or healthy in volume terms. When the opposite occurs, and either trend advances lack participation or reactions draw heavier volume, the trend may be considered vulnerable or in a phase of distribution or absorption. These labels are descriptive, not predictive. They help frame questions about the durability of a move and the type of participants likely to be active.
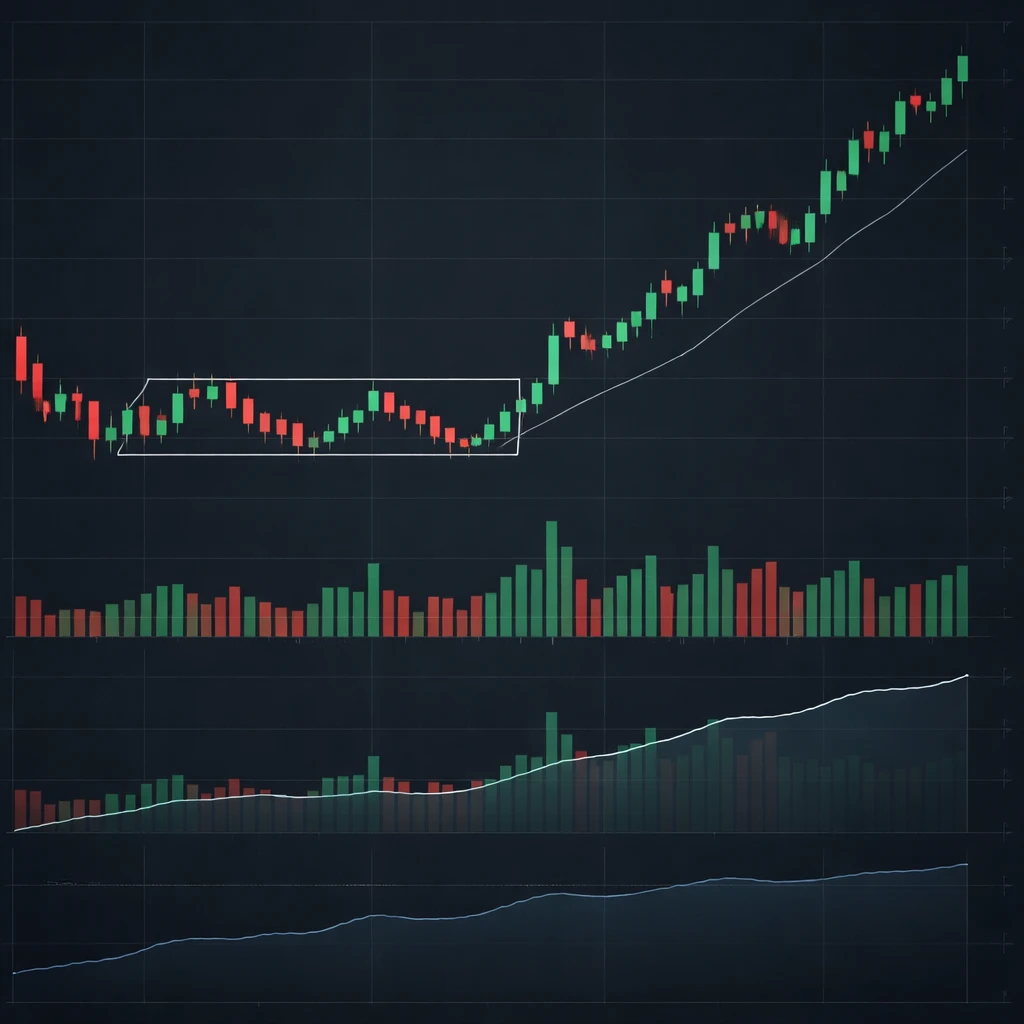
How Volume Appears on Charts
Volume is commonly displayed as a histogram at the bottom of price charts. Each bar corresponds to the volume for that time interval. Many platforms color the bar to reflect whether price closed higher or lower within the interval, though the color convention varies.
Analysts often add simple overlays and companion indicators to give structure to the raw bars:
- Volume moving average: A short baseline, such as a 20-period moving average of volume, helps classify a session as high, average, or low activity.
- Relative volume or volume ratio: A ratio of current volume to its recent average, for example 1.5 times the 20-day average, highlights unusually active sessions.
- Cumulative volume measures: Indicators such as On-Balance Volume or similar cumulative approaches aggregate volume in the direction of price closes, giving a smoothed read on whether participation is building with the trend.
- Volume by price: Horizontal histograms allocate volume across price levels, which can reveal areas where significant trading occurred and where supply and demand may have previously balanced.
In intraday analysis, additional context is commonly used. Volume is not evenly distributed across the trading day. Many markets exhibit elevated activity near the open and close and lighter trading in the midday period. Comparisons that ignore intraday seasonality can misclassify a normal lull as weak participation.
Why Market Participants Pay Attention
Volume offers a window into participation. A price move with broad participation has passed through more hands, which can indicate that multiple categories of traders and investors were involved. Moves with narrow participation may be more susceptible to reversal if they occurred on thin liquidity or through the actions of a small set of participants.
Volume also ties to liquidity and transaction costs. Higher activity often comes with tighter spreads and greater depth, which can influence how efficiently the market accommodates orders. Observing when a trend coincides with unusually high or low activity helps explain whether price is moving with ease or encountering friction.
Finally, volume patterns often reflect event risk and information flow. Corporate announcements, macroeconomic reports, rebalancing periods, or index changes can all produce atypical volume. Placing price movement in that informational context reduces the chance of misattributing a high-volume move to generic trend strength when it may be event-specific.
Interpreting Volume in Uptrends
In an uptrend, analysts typically evaluate two comparisons. First, do advances show volume expansion relative to recent averages. Second, do pullbacks show volume contraction relative to those advances. The sequence matters more than any single day.
Consider a stock that has been trending higher for several weeks. On the initial push through a prior swing high, volume prints at 2.0 times the 20-day average. The next two sessions see a modest pullback with volume near 0.8 times the average. The stock then proceeds to make a higher high on 1.6 times the average. This pattern suggests that demand is active on trend days and less active during pauses. The pullbacks are occurring with lighter participation, which often indicates a lack of aggressive supply at those moments.
Contrast that with a different sequence. A stock rises to a new high on 0.9 times average volume, then declines for two days on 1.7 times average, followed by a flat day on average volume. The trend is still intact on price alone, but the volume pattern shows that the heavier activity occurred against the prior direction. Analysts would characterize this as non-confirming volume behavior for the uptrend.
It is also useful to separate routine consolidation from distribution. Sideways stretches after a strong advance may show declining volume across the range, which can indicate a temporary pause. By comparison, if sideways price action shows volume increasing on down days within the range, some participants may be distributing shares to new buyers. Without predicting outcomes, the distinction informs how one interprets the quality of subsequent breakouts or failures.
Interpreting Volume in Downtrends
The same logic applies to downtrends. Declines that unfold with relatively heavy volume suggest strong participation from sellers. Rallies against the trend that occur with lighter volume suggest limited buying pressure.
Imagine a futures contract that falls through a multiweek floor with volume at 1.8 times its 30-day average. The next two sessions bounce modestly with volume at 0.7 times average. The contract then posts a fresh low on 1.5 times average volume. This sequence exhibits confirming volume for the downtrend. If, instead, the bounce off the lows occurs on unusually high volume while further lows print on contracting volume, the trend would lack volume confirmation.
Downtrends often feature capitulation events. A capitulation day is characterized by a wide price range, a large downward close, and extraordinary volume relative to recent history. The interpretation is subtle. Volume is confirming the strength of the current move, yet such extremes can also mark exhaustion of the selling pressure for that phase. The label describes the pattern, not the prognosis for what comes next.
Divergence and Non-Confirmation
Non-confirmation arises when price and volume tell different stories. Price may achieve a marginal new high, while volume fails to reach prior peak levels. A cumulative volume indicator might trend sideways or down while price edges up. The observation is that participation is not expanding in line with price.
Divergence does not guarantee a reversal. It can persist as trends age, particularly in mature uptrends where each successive push attracts incrementally fewer participants. However, when divergence appears around key price locations such as prior highs or widely observed resistance, analysts record it as a sign of potential vulnerability. The same logic applies to downtrends that make new lows on waning volume while cumulative measures stop confirming.
Volume, Volatility, and Liquidity
Volume interacts with volatility in several ways. Heightened volatility often coincides with elevated volume as markets reprice risk and information arrives rapidly. Conversely, quiet markets may show reduced volume and narrower ranges. Yet the relationship is not one-to-one. A market can be volatile with low volume if liquidity is thin, producing larger price changes per trade, or it can be active with modest volatility if order flow is balanced.
For trend confirmation, volatility provides context for what constitutes meaningful volume. In a high-volatility phase, a session at 1.2 times average volume may be unremarkable, while in a low-volatility phase the same ratio might indicate pronounced interest. Analysts often normalize volume not only relative to its own history but also in relation to the prevailing volatility regime.
Liquidity conditions also matter. Spreads and depth vary across instruments and venues. A thinly traded asset can show dramatic percentage changes in volume that are not comparable to the same ratios in a highly liquid index future. Interpreting confirmation requires awareness of baseline liquidity, typical trade sizes, and whether volume reflects genuine two-sided interest or a temporary imbalance.
Event-Driven Volume Patterns
Events inject information and mechanical flows into markets. Earnings releases, management updates, economic data, central bank decisions, index rebalances, and futures contract rolls can all alter volume patterns. During these windows, price moves may align with the prevailing trend while volume surges for reasons that are partly exogenous to the trend itself.
For example, a positive earnings surprise can produce a breakout on exceptional volume. The event accelerates participation, and volume confirms the move in the narrow sense. However, the interpretation benefits from recognizing the event source. Some portion of the volume reflects new information and portfolio adjustments unrelated to the earlier trend. Similarly, at quarter-end rebalances, volume may rise sharply with little directional information. Price can move in line with the trend, but the participation is driven by calendar mechanics.
Separating event-driven volume from trend-driven volume does not mean ignoring it. Rather, it encourages a structured reading. Analysts compare the event bar to similar prior events, assess whether the surge is sustainable, and observe how volume behaves in the sessions that follow once mechanical flows subside.
Timeframe and Microstructure Considerations
Interpretation depends on timeframe. On daily charts, a comparison to a 20-day volume average is common. On intraday charts, participation varies markedly by time of day. Many markets feature an opening auction, an active first hour, a quieter midday, and a ramp into the close as institutions execute larger orders. Judging a midday pullback as weak participation may reflect normal intraday seasonality rather than genuine disinterest.
Microstructure affects volume prints. Off-exchange trading, dark pools, and alternative venues can shift where and when trades are reported. In futures, volume aggregates across multiple exchanges and can be influenced by rollover activity as traders migrate to a new contract. In foreign exchange, spot markets do not have centralized volume, so many charting platforms display tick count as a proxy for activity. Tick volume can correlate with actual activity, yet it is not identical to centralized exchange volume in equities or futures.
These microstructure details do not invalidate volume in trend confirmation. They simply advise caution when comparing across asset classes and remind analysts to anchor interpretations in the data structure of the market being studied.
Practical Chart-Based Context
Consider a hypothetical daily chart of a large-cap equity over eight weeks. The stock bases between 48 and 52 for two weeks with volume near its 20-day average. On day 11, price closes above 52.50 after pushing through the range high. Volume registers 2.3 times the 20-day average. Over the next three sessions, price consolidates between 52.20 and 53.10 with volume at 0.75 to 0.90 times average. On day 15, the stock closes at 54.20 on 1.6 times average volume. The pattern shows volume concentrating on the upside moves and easing during digestion periods.
During week five, the stock advances further, but the new high at 56.00 arrives on 0.95 times average volume. The next day, price dips to 55.10 on 1.4 times average volume. A simple cumulative volume line flattens despite the higher price. This is a textbook non-confirmation observation. It does not predict reversal, yet it invites a closer look. Analysts might examine whether event risk is pending, whether the instrument is entering a seasonally quieter period, or whether liquidity conditions changed.
Suppose week six includes an earnings release. Price gaps up to 58.50 and trades on 3.1 times average volume. Intraday, the stock’s volume clusters in the first hour and final thirty minutes, and spreads are briefly wider. Post-event, during week seven, volume returns to 1.1 times average with price holding above 57.50. Here, volume confirmed the event-driven move at the gap, but the sustained baseline following the event provides additional context for the trend’s durability.
Now consider a downtrend example in a commodity future. Price breaks below 92.00 on 1.9 times the 30-day average volume. The following two sessions rally modestly back to 92.10 with 0.6 times average volume. On the next leg lower to 89.50, volume prints 1.5 times average. Late in the move, a wide-range day with a low at 87.00 and a close at 88.20 trades at 3.0 times average volume. The range and volume suggest capitulation within the downtrend. Subsequent days show reduced volume and narrower ranges as the market reassesses. Throughout, the alignment of heavier activity with the trend direction provided confirmation, while the extreme day requires careful interpretation.
Common Pitfalls and Data Nuances
Several recurring pitfalls complicate volume interpretation if left unaddressed:
- Ignoring base rates: Declaring a day as high volume without reference to a baseline invites misclassification. Relative metrics, such as ratios to a moving average or a z-score, provide scale.
- Overgeneralizing across assets: A 50 percent increase in volume means different things in a thinly traded small-cap compared with a liquid index ETF. Liquidity regimes differ.
- Seasonality and calendar effects: Summer months, holiday periods, month-ends, and quarter-ends can distort volume. Comparing like-for-like periods reduces noise.
- Data quality and corporate actions: Splits, symbol changes, and consolidated tape adjustments can alter volume histories. Clean data is essential for consistent interpretation.
- Proxy volume in decentralized markets: In markets without centralized reporting, tick volume may stand in for actual volume. It can be informative but should not be treated as equivalent to exchange-reported volume.
Another subtle pitfall is anchoring on absolute thresholds. Declaring that a trend is confirmed only when volume exceeds a fixed number overlooks context. A flexible approach that accounts for volatility, liquidity, and event calendars yields more reliable interpretations.
Supplementary Volume Measures
Although the raw histogram and simple averages cover most needs, supplementary measures can sharpen interpretation:
- On-Balance Volume: Cumulates volume by adding volume on up closes and subtracting on down closes. Rising OBV during an uptrend shows that participation is building with price.
- Accumulation and distribution style metrics: These methods weight volume by where the close sits within the bar’s range, offering nuance about intrabar pressure.
- Up volume versus down volume: Comparing volume on sessions that close higher with volume on sessions that close lower helps reveal which side is more active.
- Volume breadth for indexes: In equity indexes, advancing volume versus declining volume across constituents can indicate whether a move is concentrated or broad.
- Volume profile: Allocating volume at price levels shows where past activity was dense, often aligning with areas that later act as magnets or areas of hesitation.
These tools do not replace price analysis. They provide corroboration. When multiple volume lenses are aligned with the price trend, the interpretation of confirmation gains weight. When they conflict, the message is mixed and warrants caution.
Normalizing and Benchmarking Volume
Normalized metrics help separate signal from noise. Three practical approaches appear frequently in analysis:
- Moving average ratios: Report volume as a multiple of a recent moving average, such as 1.4 times the 20-day average. This is simple and widely understood.
- Standardized scores: Compute a z-score using the recent mean and standard deviation of volume. A value of 2.0 indicates current volume is two standard deviations above the recent mean.
- Percentile ranks: Evaluate the current session’s volume relative to the past year’s distribution. A 90th percentile day is unusually active in that historical context.
Benchmark selection should match the timeframe and use case. Intraday relative volume often references time-of-day curves, while swing analysis relies on daily or weekly baselines. The aim is consistency, which allows meaningful comparisons of whether volume is confirming the trend from one period to the next.
Why Confirmation Is Not Sufficiency
Volume confirmation strengthens a narrative about trend quality, yet it does not determine outcomes. Markets can and do reverse after seemingly strong confirmation, and they can also grind higher or lower for long stretches on subdued volume. Volume should be treated as one dimension in a multiperspective assessment that includes price structure, volatility regime, liquidity conditions, and known catalysts.
Recognizing the limits of the concept prevents overconfidence. Volume clarifies participation. It does not forecast duration or magnitude on its own. Used responsibly, it frames better questions about what type of activity is driving the market at any moment.
Key Takeaways
- Volume in trend confirmation focuses on whether moves in the trend direction occur on relatively higher volume and countertrend moves occur on relatively lower volume.
- Chart evidence includes volume histograms, moving averages of volume, and cumulative volume indicators that reflect whether participation is building with price.
- Non-confirmation appears when price makes progress without corresponding volume support or when countertrend moves dominate activity.
- Context matters, including volatility regime, liquidity, event calendars, and microstructure features that shape the meaning of a given volume surge or lull.
- Confirmation strengthens interpretation but is not sufficient on its own, and it should be integrated with broader analysis without implying predictions or recommendations.