Volume is the count of transactions that change hands within a defined period. In technical analysis, it is often treated as the observable footprint of participation. When participation expands, more capital and more orders are involved in setting prices. When participation contracts, fewer traders and investors are present to support or oppose movement. The phrase volume as market participation highlights a simple idea. Price shows where a market moved, volume helps gauge how many market participants were involved in that move.
Interpreting volume does not predict outcomes. It provides context about the character of price changes and the liquidity conditions behind them. Used thoughtfully, volume can sharpen a reader’s understanding of conviction, uncertainty, or imbalance, particularly when evaluated alongside volatility, time of day, and event risk.
Defining Volume as Market Participation
In exchange-traded instruments such as equities and futures, volume is recorded as the number of shares or contracts traded over a chosen interval. In spot foreign exchange, a centralized volume figure does not exist. Traders often rely on broker-provided tick volume, which counts price updates as a proxy for activity. In on-chain digital assets, exchanges report traded units, though fragmentation and wash trading can distort figures. Despite these differences, the conceptual link is consistent. Higher observed activity indicates broader or more intense participation, while lower activity suggests fewer active participants or thinner liquidity.
Two properties of volume are central to its interpretation as participation.
- Magnitude. The absolute level of trades in a period conveys how many units changed hands. Magnitude helps distinguish routine sessions from outliers.
- Change relative to a baseline. A period that registers double its 20-day average volume often represents an unusual level of engagement. Baselines can be moving averages, medians, or seasonally adjusted references.
Volume by itself is not directional. It does not say whether buyers or sellers dominated without additional inference from price. Instead, it describes how many trades occurred when price moved a certain way.
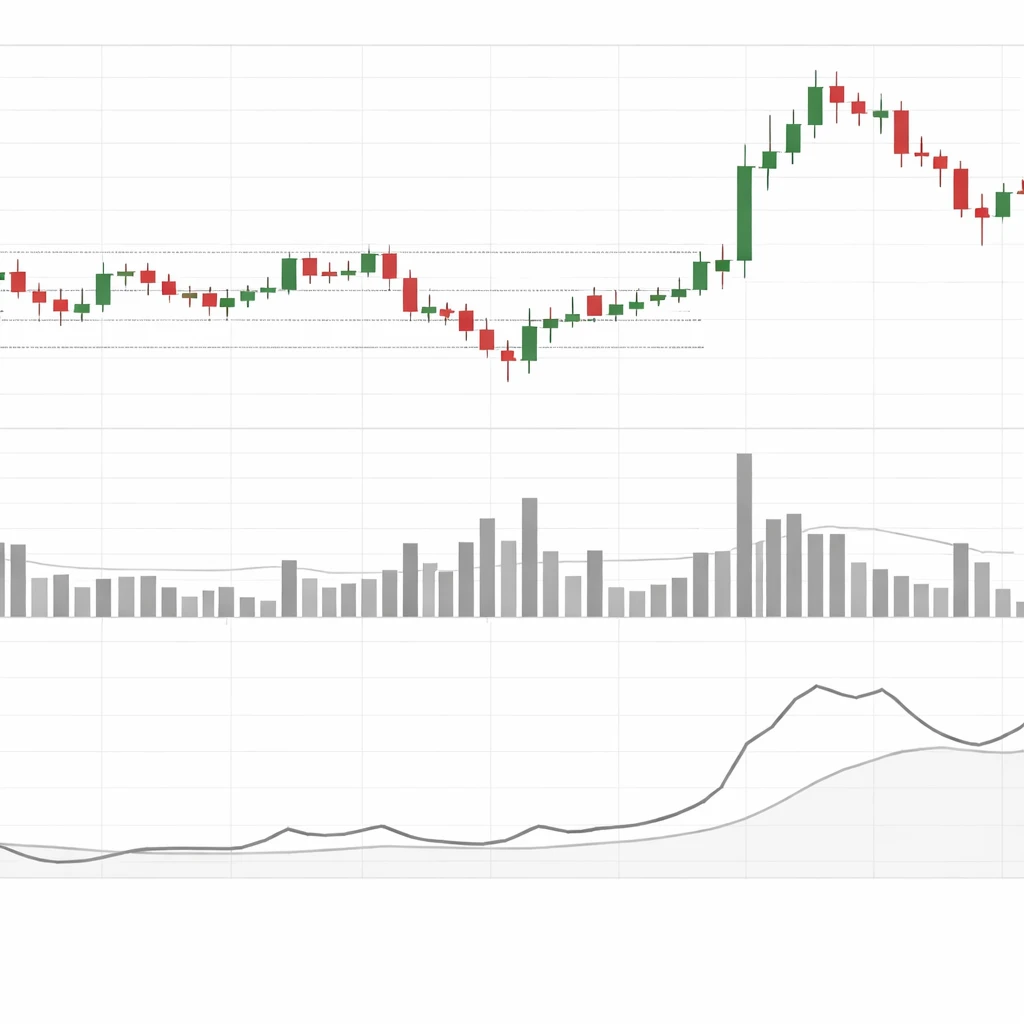
How Volume Appears on Charts
Most charting platforms plot volume as a histogram beneath price. Each bar corresponds to the same time interval used for the price chart. Colors typically reflect whether price closed higher or lower than the prior period. A green or blue bar may indicate an up close, a red bar a down close. Coloring is a convention and does not change the data itself.
Common augmentations include a moving average of volume to provide a baseline, and separate panels that display derived indicators using volume, such as On Balance Volume or money flow variants. These derived lines attempt to summarize whether volume coincided more with upward or downward closes over time. They are interpretive aids rather than ground truth.
The visual signature of participation on a chart often includes identifiable patterns.
- Spikes. Tall, isolated bars stand out during news, earnings, policy decisions, or market opens and closes. Spikes are the clearest visual cue that many orders met in a short window.
- Dry-ups. Clusters of small bars indicate muted activity, often seen during holidays, pre-event waiting periods, or mid-session lulls.
- Persistent elevation. A sustained run of bars above the baseline suggests an extended phase of high engagement, as occurs in trends with broad participation or during protracted price discovery after a regime shift.
On intraday charts, volume often follows a U-shaped pattern, with heavier activity near the open and close and lighter activity in the middle. On daily charts, seasonality can appear around quarter ends, index rebalances, and earnings seasons. Recognizing these rhythms prevents misclassification of normal cyclical changes as unusual signals.
Why Market Participants Pay Attention to Volume
Volume helps readers judge how representative a price move might be. A change in price on light volume can occur with relatively little opposition if liquidity is thin. A comparable change on heavy volume implies more orders were consumed or joined, which often suggests broader participation. Neither situation guarantees future follow through. The interpretive value lies in framing how much effort accompanied the move.
Several reasons motivate close attention to volume.
- Context for price swings. Large candles with modest volume portray a different market condition than large candles with extreme volume. The former may reflect an air pocket in liquidity, the latter a crowd response to information.
- Assessment of conviction. When price tests an important reference such as a prior high, many readers check whether volume expands or contracts. Expansion indicates more traders transacted at the new level, which can change perceptions of acceptance.
- Risk awareness. High volume and high volatility often coincide during uncertainty. Recognizing this coupling can help frame the range of possible outcomes and the likelihood of price overshoot or whipsaw.
- Microstructure insight. Volume patterns hint at order flow dynamics. Absorption, where large sell orders meet persistent buying, can produce heavy volume with limited downside progress. Exhaustion, where participants stop pressing, can produce volume spikes near turning points.
Linking Volume to Price Behavior Without Prescribing Trades
Technical analysis commonly discusses volume in relation to specific price conditions. The intent here is not to suggest entries or exits, but to explain interpretive logic that readers use to diagnose what the market’s participation might be signaling about the quality of a move.
- Range expansion with high volume. When a market breaks from a consolidation and posts a wide range along with a clear volume surge, the inference is that many participants agreed to transact at new prices. The move is often read as a meaningful update in the collective valuation process.
- Range expansion with low volume. A wide move without notable volume can reflect thin liquidity or off-hours trading. The same price change achieved with little participation may be more fragile, since fewer positions have changed hands to anchor the new level.
- Tests of reference levels. Price revisiting a prior high or low with rising volume suggests increased interest and potential acceptance. Revisits on declining volume suggest hesitation or lack of broad interest at the level.
- Volume divergence. Trends that continue while volume trends lower prompt questions about sustaining participation. Conversely, a stalling or reversing market with rising volume hints at new or opposing interest stepping in.
None of these observations dictate an action. They provide a structured vocabulary for reading participation and relating it to price behavior.
Volume and Volatility
Volume and volatility are linked but not identical. Volatility measures the variability of price, such as the standard deviation of returns or an average true range. Volume measures activity. They often move together during stress or surprise when many participants respond at once. However, they can diverge.
- High volume with modest volatility. When liquidity is deep and two-sided, heavy trading may occur within a relatively contained range. This is common during rebalances or mechanical flows that match promptly.
- Low volume with high volatility. In thin markets, small orders can move price far if the order book is shallow. Off-hours futures or low-float equities sometimes exhibit this pattern.
Because volatility can expand on both heavy and light volume, the analyst benefits from considering both measures together. Large moves on heavy volume suggest broad re-pricing. Large moves on light volume point to liquidity gaps or transitory conditions. Small moves on heavy volume suggest absorption or inventory transfer within a range. Small moves on light volume often characterize indecision or waiting.
Measurement Nuances Across Markets
The integrity and meaning of volume depend on the market’s structure.
- Equities. Reported share volume aggregates across venues and includes off-exchange prints in many jurisdictions. Corporate actions can require normalization. Splits alter per-bar share counts and should be adjusted when comparing history.
- Futures. Contract roll matters. As the front month nears expiration, volume migrates to the next contract. An unadjusted chart can show artificially falling volume that reflects calendar mechanics rather than participation trends.
- Foreign exchange. Tick volume is a proxy that often correlates with actual activity but is venue-specific. Comparison across brokers may differ due to feed construction.
- Digital assets. Exchange-reported volume can be inflated by incentives or non-economic trades. Many analysts use multiple venues, time-weighted averages, or blockchain metrics to cross-check activity.
Time-of-day and calendar effects are also material. Volume is usually highest at market open and close, and during overlapping sessions in global markets. It often wanes near major announcements then surges after the release. Treating these patterns as normal reduces misinterpretation.
How Analysts Display and Compare Volume
To compare volume meaningfully, chart users often employ baselines and normalizations.
- Moving average of volume. A 20-day or 50-day average allows quick evaluation of whether current activity is above or below typical conditions.
- Relative volume ratios. Intraday tools track actual volume against expected volume for that time slice, which controls for intra-session seasonality.
- Weekly or monthly aggregation. Multi-week totals reveal whether a trend unfolded with rising or falling participation across higher time frames.
- Volume profile and time-price analysis. Some charts display how much volume traded at each price level rather than each time interval. This perspective emphasizes price acceptance zones and areas with little historical agreement.
These displays are descriptive. They do not add information beyond the raw record, but they reorganize it to answer specific questions about participation.
Practical Chart-Based Context
Example 1, Break from a Multiweek Range
Consider a stock that trades between 48 and 52 for several weeks with daily volume near its 20-day average. One session prints a decisive close at 53 with a wide candle, and the day’s volume is twice the 20-day average. Interpreting volume as participation, the chart indicates that many orders agreed to transact above the prior acceptance. The price move is not just a thin print through an illiquid pocket. It represents a broad update in consensus within that session.
A similar price break without the volume surge would be read differently. The absence of elevated participation leaves open the possibility that the move occurred through a temporary liquidity gap or at a time when many potential counterparties were inactive.
Example 2, Pullback on Light Volume
Suppose an index has been rising for several weeks accompanied by steady or increasing volume on up days. It then retraces for three days on markedly lighter volume than the preceding advance. Price has moved lower, but fewer units have changed hands during the pullback. Some analysts read this as a lack of strong participation by sellers, which differs in character from a retracement marked by heavy distribution. The distinction does not forecast the next move. It clarifies whether the pullback looks like a routine pause with muted engagement or a forceful shift in participation.
Example 3, Capitulation and Absorption
A commodity future drops sharply during a macro shock. One session shows extreme intraday volatility and one of the largest volume bars of the year. Yet the candle closes off the lows after testing them repeatedly. Heavy volume with a long lower wick suggests that selling pressure met significant buying interest, often described as absorption. The high volume shows many participants were active, while the intraday reversal hints that buyers were able to meet and offset substantial sell flow at lower prices. Readers may infer that a large transfer of inventory occurred without concluding that a lasting low is in place.
Example 4, Thin Hours and Large Moves
In an overnight futures session, price gaps several points on news, and the accompanying volume bar is modest relative to daytime activity. The move is large in points but occurred with fewer trades because liquidity providers were scarce. The chart illustrates why volume and volatility must be read together. Sizeable price change with limited participation can be more sensitive to later reversion once regular liquidity returns, compared with a similarly sized move during the cash session with heavy volume.
Interpreting Volume Across Time Frames
Participation has a time dimension. A daily chart can show a healthy series of elevated volume bars during a trend, while a weekly chart reveals whether that elevated activity persists when aggregated. The weekly view can filter out noise from single-day events and highlight whether multiweek moves are occurring with cumulative participation.
Intraday charts add a different layer. A five-minute spike at the open may look dramatic, but when rolled into the daily bar it becomes a normal contribution to a high-volume day. Conversely, several mid-session surges that repeat over consecutive days can accumulate into a meaningful elevation in weekly volume, which signals that participation has broadened across multiple sessions, not just at known high-activity windows.
Seasonality, Events, and Structural Rhythms
Volume follows recurring patterns tied to calendar, index mechanics, and news flow. Understanding these rhythms is part of reading participation accurately.
- Open and close concentration. Many institutional workflows target the opening and closing auctions, which commonly anchor the highest intraday volumes.
- Earnings and macro releases. Company reports, inflation data, employment figures, and central bank decisions often draw traders off the sidelines and create volume spikes.
- Rebalances and expirations. Index changes and derivatives expirations can produce exceptional but mechanically driven volume. Price may remain contained if flows are matched efficiently.
- Holidays and seasonal slowdowns. Certain weeks historically show thin participation. Volume dry-ups during these intervals are normal and should not be overinterpreted.
Distinguishing event-driven volume from spontaneous crowd interest helps prevent false inference. A chart that annotates expected events alongside volume columns can be useful for study purposes.
Data Quality, Scaling, and Comparability
Reliable interpretation starts with careful handling of data.
- Adjustments. Splits, symbol changes, and contract rolls should be adjusted in historical series to maintain comparability. Without adjustment, historical volume or price may show artificial jumps or drops.
- Venue aggregation. For equities and digital assets, combining multiple execution venues improves representativeness. A single-venue feed can miss material flow.
- Relative scaling. Comparing volume across instruments or across long time spans benefits from normalizing by shares outstanding, float, or using z-scores relative to a rolling window. This converts raw counts into interpretable deviations from typical activity.
- Time normalization. Intraday relative volume that accounts for expected participation by minute or hour avoids labeling the routine midday lull as unusually quiet.
These practices improve the analyst’s ability to distinguish true participation shifts from artifacts of data construction.
Common Pitfalls in Reading Volume
Volume is a descriptive statistic that is easy to misuse. Several pitfalls appear frequently.
- Assuming causality. High volume does not cause price to move in a particular direction. It co-occurs with movement when many participants update positions.
- Ignoring market structure. A move during a rebalance may carry high volume for mechanical reasons that do not reflect discretionary conviction. Microstructure context is essential.
- Over-reliance on color conventions. A red volume bar means the close was below the prior close, not that sellers dominated every trade. The tape often contains intense two-sided flow even when the candle closes down.
- Confusing volatility with participation. Large candles without volume expansion can result from thin books, not broad interest. The opposite is also true, heavy volume can occur within tight ranges.
- Forgetting aggregation effects. A sequence of moderate-volume days can sum to a significant weekly or monthly participation shift. Focusing on single bars may miss the bigger picture.
Building a Coherent Reading of Participation
A coherent reading integrates volume with price structure, volatility, and time. The analyst identifies where price has been accepted or rejected, then checks whether engagement increased or decreased at those locations. Event calendars and market structure help separate mechanical from discretionary flow. Finally, comparisons across time frames determine whether participation is expanding or contracting in a sustained way.
This framework remains descriptive. It does not prescribe trades or assert certainty about what comes next. It equips the reader to characterize how many market participants were involved in the move that has already occurred, and whether that involvement looks broad, narrow, persistent, or temporary.
Key Takeaways
- Volume is best understood as a measure of market participation that complements, but does not replace, price and volatility.
- Chart presentation matters. Baselines, seasonality, and venue differences help distinguish truly unusual activity from normal rhythms.
- Large price moves with heavy volume suggest broad engagement, while large moves with light volume often reflect liquidity gaps.
- Event context and market structure can drive volume without implying directional conviction, which cautions against simplistic readings.
- Comparing participation across time frames provides a more reliable view of whether engagement is expanding, contracting, or simply shifting in time.