Price often moves most decisively when a market transitions from balance to imbalance. Two observable inputs help frame that transition: volume and volatility. Volume reflects the degree of participation and activity at traded prices. Volatility captures the magnitude of price fluctuation. When a market breaks out of a well-defined range, triangle, or other consolidation, the interaction between volume and volatility often changes. Understanding these changes helps interpret the quality and context of the move, without implying a prediction or prescribing a trade.
Defining Volume and Breakouts
Volume is the total quantity of units traded in a given period. In centralized markets such as listed equities or futures, volume is aggregated by the exchange and displayed in histogram bars beneath a price chart. In decentralized markets such as spot foreign exchange, traders often use tick volume as a proxy for activity, which counts price updates rather than contracts or shares. In crypto markets, volume is exchange specific, so aggregated feeds combine data from multiple venues with varying methodologies.
Breakout refers to a price move that travels beyond a boundary that has contained prior fluctuations, such as a horizontal range, a trendline, or the edge of a chart pattern. Many chartists define a breakout using closing prices relative to a level of resistance or support. Others require a minimum distance beyond the boundary, commonly expressed as a fixed amount or percentage. These definitions vary, but the core idea is consistent. Price transitions from a confined regime to a new area where prior transactions were sparse.
How Volume and Breakouts Appear on Charts
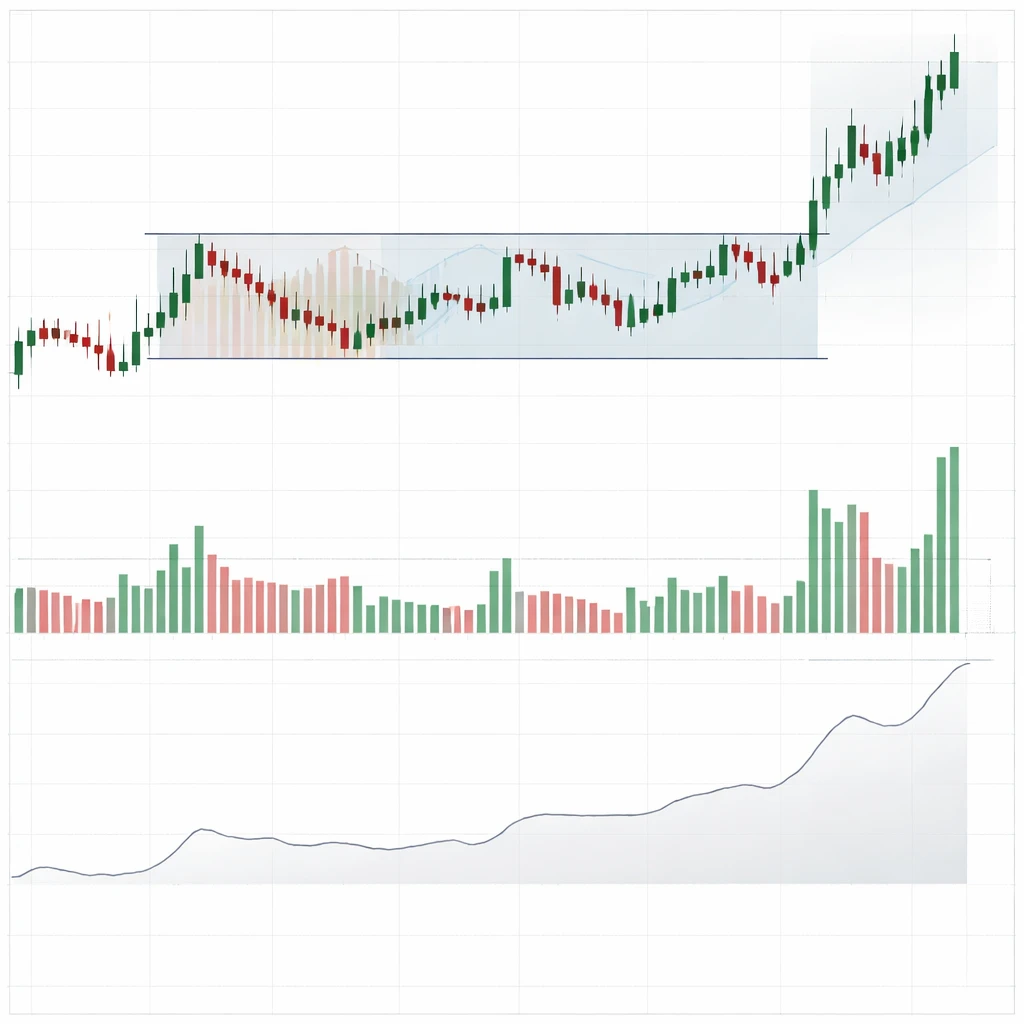
On a typical candlestick chart, volume appears as vertical bars in a separate pane. During consolidations, volume often contracts, forming smaller bars as the market trades repeatedly within a limited range. Price bars also tend to narrow, reflecting reduced volatility. A breakout is visible when price closes beyond the consolidation boundary. Market participants then assess whether the breakout coincides with changes in volume and volatility.
Several chart features often accompany this transition:
- Price structure. A clear consolidation zone, such as a rectangle or triangle, followed by a price close outside that zone.
- Volume expansion or contraction. A visible change in volume relative to what preceded the breakout. This may be sudden, with one or two large volume bars, or gradual, with rising volume across multiple periods.
- Volatility shift. Wider candles, larger intraday ranges, or indicators that proxy volatility, such as Average True Range, moving higher after the breakout.
Why Market Participants Pay Attention
Volume is often interpreted as a measure of participation and conviction. When a breakout occurs with an increase in turnover, observers infer that new orders joined the move and that previous resting orders at the boundary were absorbed. In contrast, a breakout with little change in volume can indicate that the move occurred in a thin environment. Thin conditions can occur during off hours, holidays, or within markets that already show limited depth. Thin moves sometimes retrace when liquidity returns.
Volatility provides a separate but related lens. A breakout that ushers in a higher volatility regime suggests that the market is discovering new prices and that disagreement about value is high. A breakout followed by immediate volatility contraction may indicate quick resolution, as one side of the market pulls back. Neither condition guarantees persistence or reversal, but both provide context for understanding how the market is processing new information.
Volume as a Proxy for Liquidity and Participation
Liquidity describes how easily large orders can transact without materially moving price. During consolidations, liquidity often accumulates near the range boundaries. Traders place resting orders at perceived support and resistance, which can build significant depth. A breakout requires that orders on one side be overcome or withdrawn. Increased volume during a breakout suggests that marketable orders, which cross the spread and demand execution, are aggressive enough to consume the resting liquidity at the boundary.
This liquidity lens explains why some breakouts travel quickly once the boundary is breached. If the order book beyond the boundary is thin, price can gap or slide rapidly to levels where new liquidity appears. Charts reflect this as long candles or runs with minimal counter movement. Volume during these moves may remain high if aggressive activity continues, or may taper if the path forward meets less resistance. Either profile can occur across assets, though microstructure differences matter.
Volatility Regimes Around Breakouts
Volatility often compresses during consolidation. Traders may reference the width of Bollinger Bands, the reading of Average True Range, or simple visual inspection of candle size to gauge compression. A breakout frequently coincides with volatility expansion, seen as wider bars and larger gaps between session highs and lows. Expansion is informative because it shows that agreement around value has loosened and that the market is testing new areas.
Not all breakouts produce sustained volatility expansion. Sometimes the move outside the range is abrupt but brief, followed by a quick return inside the prior boundaries. This can happen when the breakout is driven by a short burst of orders, news that is rapidly discounted, or when latent resting liquidity absorbs the move. On a chart, that sequence appears as a spike beyond the range followed by a sharp reversal and a return to previous price territory.
Interpreting Confirmation and Divergence
Market participants sometimes describe breakouts as confirmed or unconfirmed. Confirmation is a descriptive label, not a guarantee. A common descriptive approach considers whether volume rises against a moving average baseline. For example, if the 20-period average volume on a daily chart is 1 million shares, a breakout day that prints 1.8 to 2.0 million shares may be described as occurring on elevated volume. A breakout that occurs near or below the baseline may be described as light.
Divergences can also occur. If price makes a new high out of a range with lower volume than the prior swing high, some analysts note a lack of participation at the new price. Conversely, if price exits a range on higher volume but then fails to extend, observers may infer that supply re-entered aggressively. These interpretations are conditional and context dependent, yet they are central to how charts are read.
Practical Chart Context: Examples
Example 1: Breakout from a Rectangle with Rising Volume
Imagine a stock that trades between 48 and 52 for six weeks on declining daily volume. The range is clear. Price tests 52 several times, each time pulling back into the range. On week seven, the stock closes at 53.20 with daily volume equal to roughly twice the 20-day average. The next day begins with a small gap and further expansion to 54.50. Average True Range, calculated over 14 periods, increases by 25 percent compared with the prior week.
A chart reader would note the coincidence of the breakout with both volume and volatility expansion. The inference is that new participants entered the tape and that the supply at 52 was consumed or withdrawn. This interpretation does not claim persistence. It simply states that the breakout was accompanied by more activity and larger ranges, which commonly occurs when markets leave well-defined balance zones.
Example 2: Low-Volume Upside Breakout that Fails
Consider a currency pair that compresses into a narrow 80-pip range during an Asian session. Near the end of that session, price edges above resistance by 15 pips on relatively low tick volume. When European liquidity arrives, the pair falls back into the range and ends the day near the midline. A chart would show a brief excursion beyond the boundary with minimal participation followed by mean reversion when participation expands.
This profile illustrates why context matters. Breakouts that occur when major centers are closed may reflect thin conditions. Once depth returns, the move may be absorbed. Again, this is descriptive rather than prescriptive. The value lies in recognizing what conditions accompanied the move.
Example 3: Downside Breakout with Volatility Expansion and Subsequent Retest
Assume a futures contract that has oscillated between 3,900 and 4,050 for several weeks. Following a macro data release, price closes below 3,900 on very high volume and the daily range is the largest in months. Over the next three sessions, the contract rallies back toward 3,900 on declining volume and with smaller ranges. It then turns lower again. On a chart, this would appear as an initial surge with volume and volatility expansion, followed by a pullback that shows reduced participation and then a resumption of the prior direction.
Observers often note the different character of the initial break versus the retest. The first move showed broad activity, while the retest was quieter, suggesting less opposition to the new price area. This pattern is commonly described in technical texts and is useful for understanding how supply and demand can shift after a boundary is crossed.
Measuring Volume and Volatility in Context
Charts provide raw volume, which can be contextualized with averages and ratios. Several simple tools are used to add perspective:
- Moving average of volume. A baseline, such as a 20-period average, helps distinguish whether current turnover is elevated or depressed relative to recent history.
- Relative volume. Compares current volume to the expected volume for the same time of day or session, which is useful on intraday charts where activity follows a daily rhythm.
- On-Balance Volume and Accumulation or Distribution. These derived lines integrate price direction with volume to depict whether volume tends to occur on up closes or down closes. They can reveal divergences around breakout attempts.
- Volume profile. Displays the distribution of volume by price rather than by time. In consolidations, profiles often show a prominent node near the range midpoint. Breakouts can move price away from this node into lower volume areas, which can be traversed quickly until a new node forms.
Volatility can be observed without complex indicators. Candle height, the frequency of gaps, and the dispersion of intraday swings all provide immediate information. Quantitative measures can aid consistency:
- True Range and Average True Range. Capture the size of price movements including gaps, which often expand as a market leaves a balance zone.
- Historical volatility. Standard deviation of returns over a window, helpful for comparing regimes across time.
- Band width measures. The distance between upper and lower bands derived from volatility, such as the width of Bollinger Bands, often contracts during consolidation and expands during breakouts.
False Breakouts and Failed Follow-Through
Breakouts do not always lead to directional extension. Two outcomes frequently noted by chart readers are false breakouts and failed follow-through. A false breakout occurs when price moves beyond the boundary but quickly returns inside the prior range. On many charts this shows up as a long wick that pierces the level, with the candle body closing back inside the prior zone. In some taxonomies influenced by Wyckoff, this is described as an upthrust above resistance or a spring below support.
Failed follow-through occurs when price closes outside the range and even sees a continuation session, but then stalls and reverses. High initial volume followed by a drop in activity can appear in these sequences, sometimes accompanied by loss of momentum. Interpreting these moves involves comparing the character of the breakout bars with what follows, rather than focusing only on the level itself.
Gaps, News, and Scheduled Events
Gaps are a special case of breakout-like behavior. A gap that opens above resistance or below support indicates that the market accepted a new range of prices between sessions. Gaps often coincide with news or earnings in single stocks, and with macro releases in index and rate products. Volume on the gap day is frequently elevated, though interpretation depends on intraday development. If the market opens with a gap and then trades narrow ranges with declining volume, the move may represent immediate repricing followed by consolidation. If the gap is followed by expanding ranges and sustained activity, the market may be engaged in continued discovery.
Scheduled macro events can create similar patterns without gaps. A release during an open session can catalyze a break from consolidation. Here, the sequencing of volume is informative. An initial surge may be followed by either continuation or quick absorption. Observing how volume behaves before, during, and after the event gives insight into whether the breakout was a brief clearing of imbalance or the start of a new regime.
Time-of-Day and Session Effects
Volume and volatility are not constant across the trading day. In many equity markets, activity concentrates near the open and close. Intraday breakouts that occur during mid-session lulls sometimes show lower participation. In futures tied to global assets, the peak activity may occur when overlapping regional sessions are open. In foreign exchange, London and New York hours typically show higher turnover than the Asian session for many pairs. These patterns matter when interpreting breakouts. A move that occurs at a typical high-activity time with a clear increase in volume relative to that time’s baseline can be interpreted differently than a move during a lull.
Asset-Class Differences and Data Nuances
Volume data quality varies by asset class. In listed equities, consolidated feeds capture the majority of on-exchange activity, but a significant portion of trading may occur off exchange. In some jurisdictions, dark pools and internalization venues route orders that are not immediately visible on lit order books. Volume prints eventually reflect much of this activity, though the timing and granularity can differ. Futures volume is centralized on the exchange where the contract lists, which aids consistency across charting platforms. Spot foreign exchange lacks a central tape, so tick volume is used as a proxy. Studies have shown that tick counts often correlate with actual volume at a broad level, but this is still a proxy. Crypto markets are fragmented across many exchanges with varying reporting standards, so aggregated volume should be interpreted with care.
These differences do not nullify the interpretive value of volume and breakouts. They simply imply that one should maintain awareness of data sources and the microstructure that generates the chart.
Post-Breakout Behavior: Consolidation, Retests, and Trend Character
After a breakout, charts often show one of three behaviors. The market may accelerate, forming a series of large candles and shallow pauses. It may consolidate near the breakout area, forming a tight range just outside the prior boundary. Or it may retest the breakout level by returning to the boundary from the new side. Each behavior carries distinct volume and volatility signatures.
- Acceleration. Sustained high volume and wide ranges are common. Pullbacks, if present, are brief and small relative to the breakout bars. This profile suggests that aggressive orders continue to drive discovery.
- Consolidation near the break. Volume typically declines after the initial burst, and ranges become tighter. This can reflect a temporary balance as the market processes the new level. A subsequent expansion, up or down, often resets the volatility regime.
- Retest. Price revisits the breakout area. Volume on the retest is often lower than on the initial break, and the ranges are narrower. Observers interpret this as a test of whether the old boundary switches role. The interpretation focuses on how easily price passes the level and what volume attends that passage.
Filters and Definitions Without Prescriptions
Different analysts use different filters to define a breakout. Examples include requiring a full candle body to close outside a boundary, specifying a percentage distance beyond a level, or applying time filters that require price to remain outside the zone for a set number of periods. The common purpose of these filters is to reduce the impact of brief excursions that occur due to random noise or temporary illiquidity. There is no single correct choice. What matters for interpretation is consistency in definition, since that consistency allows comparisons across cases.
Risk Context: When Volume and Volatility Mislead
Not all high-volume moves indicate directional strength, and not all low-volume breakouts are weak. Event-driven days can generate high volume with little net progress if order flow is two-sided and liquidity providers adjust inventory dynamically. End-of-quarter rebalancing and options expiration can also inflate volume in ways that do not align neatly with directional conviction. Conversely, some durable moves begin quietly when supply temporarily recedes, allowing price to leave the range with only modest turnover.
Microstructure noise can also complicate interpretation. Algorithmic activity can fragment prints and cluster small orders into patterns that distort intraday volume bars. Off-exchange reporting delays can shift when volume appears. In thin markets, a few large orders can dominate the day’s activity. These factors do not negate the usefulness of volume and volatility, but they underscore that chart interpretation benefits from humility about what a single bar can reveal.
Putting It All Together on a Chart
A coherent chart reading ties together structure, participation, and movement. One practical way to organize the analysis is to check four elements:
- Structure. Is there a well-defined range or pattern, and is the breakout definition consistent across charts and timeframes being reviewed.
- Participation. How does current volume compare with recent baselines or relative volume for the time of day.
- Movement. Has volatility expanded or contracted since the breakout, and by how much relative to an objective measure such as Average True Range.
- Location. Where is price in relation to prior high-volume nodes on a volume profile, and are there low-volume areas ahead that might be traversed quickly.
This checklist-like framing keeps the focus on descriptive interpretation rather than prediction. The goal is to understand how the market is transitioning between states, and how the interaction of volume and volatility reflects that process on the chart.
Concluding Remarks
Volume and breakouts form a natural pairing in technical analysis. Breakouts mark the transition from balance to discovery. Volume gauges participation in that transition. Volatility reveals how forcefully price is moving through new territory. By reading these elements together, one can form a grounded interpretation of price behavior that respects the limits of what charts can infer. The value lies less in a specific rule and more in the disciplined observation of how structure, participation, and movement change when a boundary is crossed.
Key Takeaways
- Volume measures participation, while volatility measures the magnitude of price change. Both often shift materially during breakouts.
- Breakouts from clear consolidations frequently coincide with volume expansion and wider ranges, though outcomes remain uncertain.
- Context matters. Time of day, asset class microstructure, and event-driven flows can alter how volume and volatility appear on charts.
- False breakouts and failed follow-through are common. Interpreting post-break behavior often hinges on changes in volume and volatility.
- Consistent definitions and simple baselines for volume and volatility support clearer interpretation without implying prediction or recommendation.