Volume & Volatility

Understanding participation, volatility expansion, and market conviction.

Part of Technical Analysis

What you will learn

This scope is designed to help you build a practical understanding of Volume & Volatility. Lessons move from core definitions to real-world context and common failure points.

Lessons

Reading in order is recommended, but each lesson stands on its own.

12 min read
Intermediate

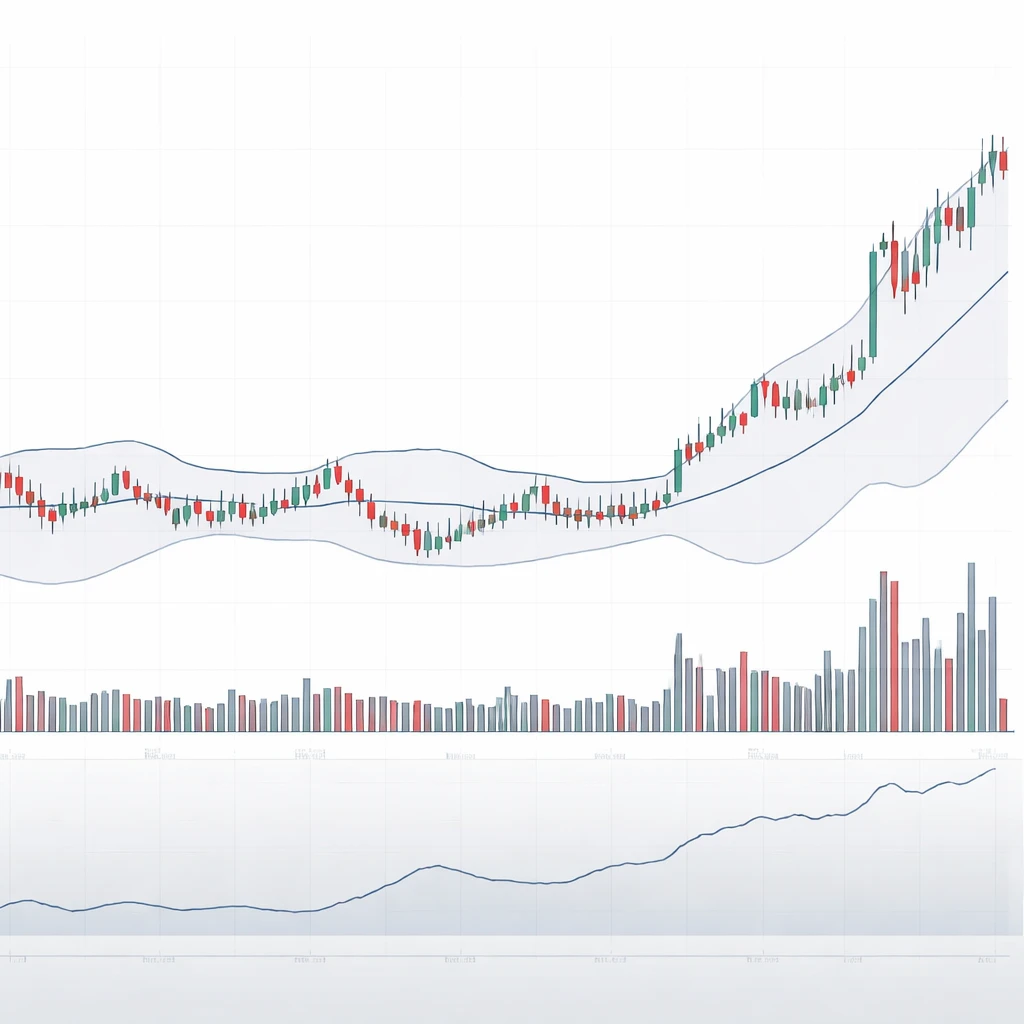
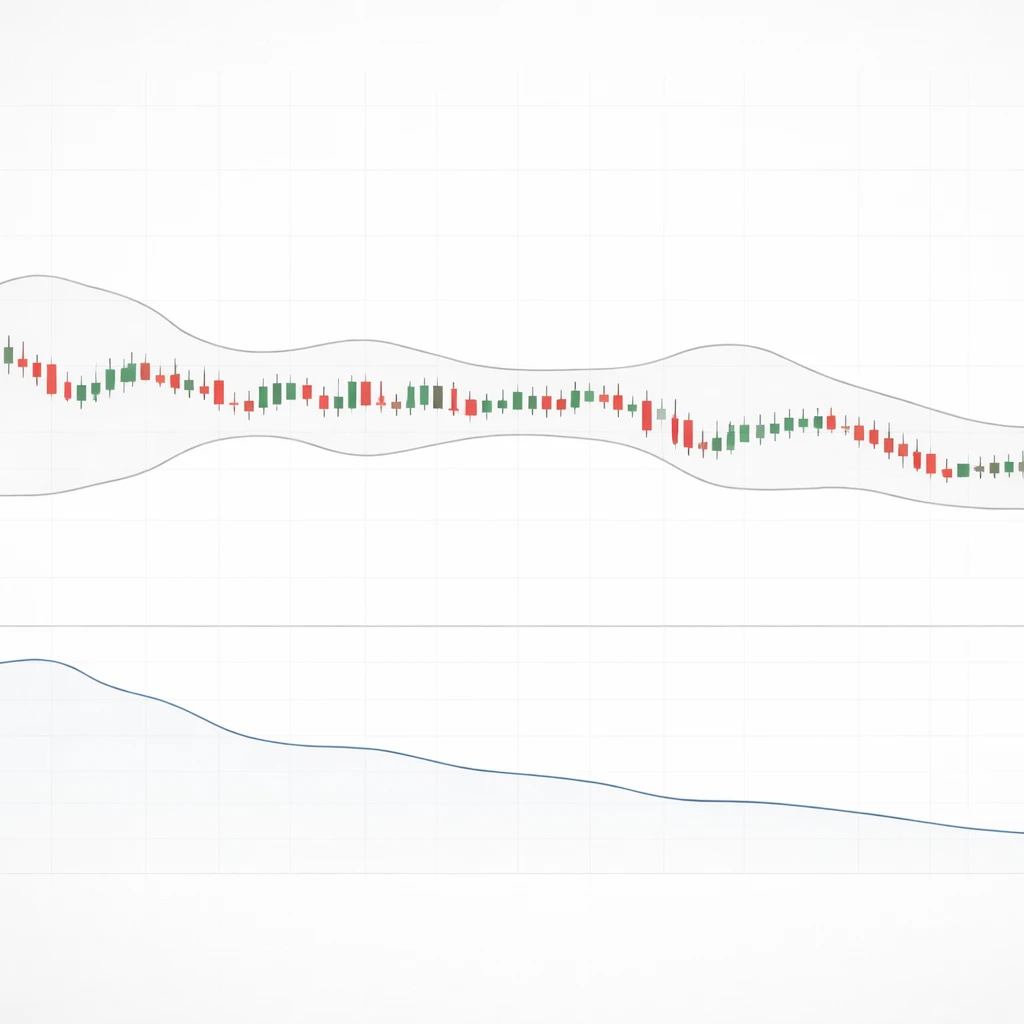
Low Volatility Environments

An in-depth explanation of low volatility environments in technical analysis, how they appear on charts, why they matter for interpreting market behavior, and how to contextualize them with volume and common volatility measures without proposing trades or setups.

12 min read
Intermediate

Volume and Volatility Together

An in-depth explanation of how trading volume and price volatility interact on charts, why the relationship matters for interpreting market behavior, and how to read common configurations without implying strategies or recommendations. Includes practical chart-based context and data nuances across asset classes.

12 min read
Intermediate

High Volatility Environments

High volatility environments are periods when price ranges, dispersion, and uncertainty rise sharply relative to recent norms. This article clarifies how to recognize these conditions on charts, the role of volume, and why technical analysts treat volatility as a market state that affects how prices move and how indicators behave.

12 min read
Intermediate

Misinterpreting Volume Data

An in-depth examination of how volume is recorded, displayed, and often misread on charts, and how careful context helps interpret price behavior without confusing noise for information. The article clarifies data construction, common chart illusions, market-specific quirks, and the unstable link between volume and volatility.

11 min read
Intermediate

Limitations of Volume and Volatility

An analytical examination of how volume and volatility can mislead when interpreted without context, including how these limitations appear on charts and why understanding them matters for reading market behavior accurately. No strategies or recommendations.