Average True Range, commonly abbreviated ATR, is a foundational volatility indicator in technical analysis. It measures the typical magnitude of price movement over a chosen window. ATR does not indicate trend direction or forecast future prices. Its purpose is to quantify how much price has been moving, in absolute terms, including the effect of gaps between sessions.
ATR was introduced by J. Welles Wilder Jr. in 1978 in his book New Concepts in Technical Trading Systems. Although originally developed for commodities, the indicator is widely applied across equities, exchange-traded funds, foreign exchange, index futures, and cryptocurrencies. By design, ATR is scale dependent. It is expressed in the same units as price, such as dollars, points, or pips.
What ATR Measures
ATR summarizes the typical range of price over a specified lookback. It is built from True Range, which represents the most expansive measure of movement for a single period. In simple terms, ATR answers the question: how wide have price swings been recently, on average, including the effect of gaps between closes.
ATR reflects magnitude, not direction. Rising ATR indicates expanding movement, whether associated with advancing prices, declining prices, or choppy swings. Falling ATR indicates contracting movement and relatively quiet trading conditions.
True Range: The Building Block
Wilder defined True Range (TR) for each period using three candidates and taking the maximum of the set. For period t with high Ht, low Lt, and close Ct, and the prior close Ct−1, the three candidates are:
- Ht minus Lt (the intraperiod high low range)
- Absolute value of Ht minus Ct−1 (captures a gap up)
- Absolute value of Lt minus Ct−1 (captures a gap down)
True Range for the period is the maximum of those three values. This definition ensures that a gap between yesterday’s close and today’s open is included in volatility measurement, not ignored. For markets that trade nearly around the clock, gaps may be infrequent, but for single session markets and many equities, gaps are common and can be material.
From True Range to Average True Range
ATR is a smoothed average of True Range values across a chosen number of periods. Wilder’s original specification used a 14 period window with a specialized smoothing that behaves like an exponential moving average. The initialization is the simple average of the first 14 True Range values. Each subsequent ATR value is computed as:
ATRt equals [ATRt−1 multiplied by (n minus 1) plus TRt] divided by n, where n is the lookback length.
Many charting platforms allow users to choose the lookback and the smoothing method. Using a simple moving average of TR rather than Wilder’s smoothing produces a similar but slightly more jagged line. Shorter lookbacks make ATR respond quickly to fresh volatility but also increase noise. Longer lookbacks reduce noise but add lag, which can delay recognition of regime changes.
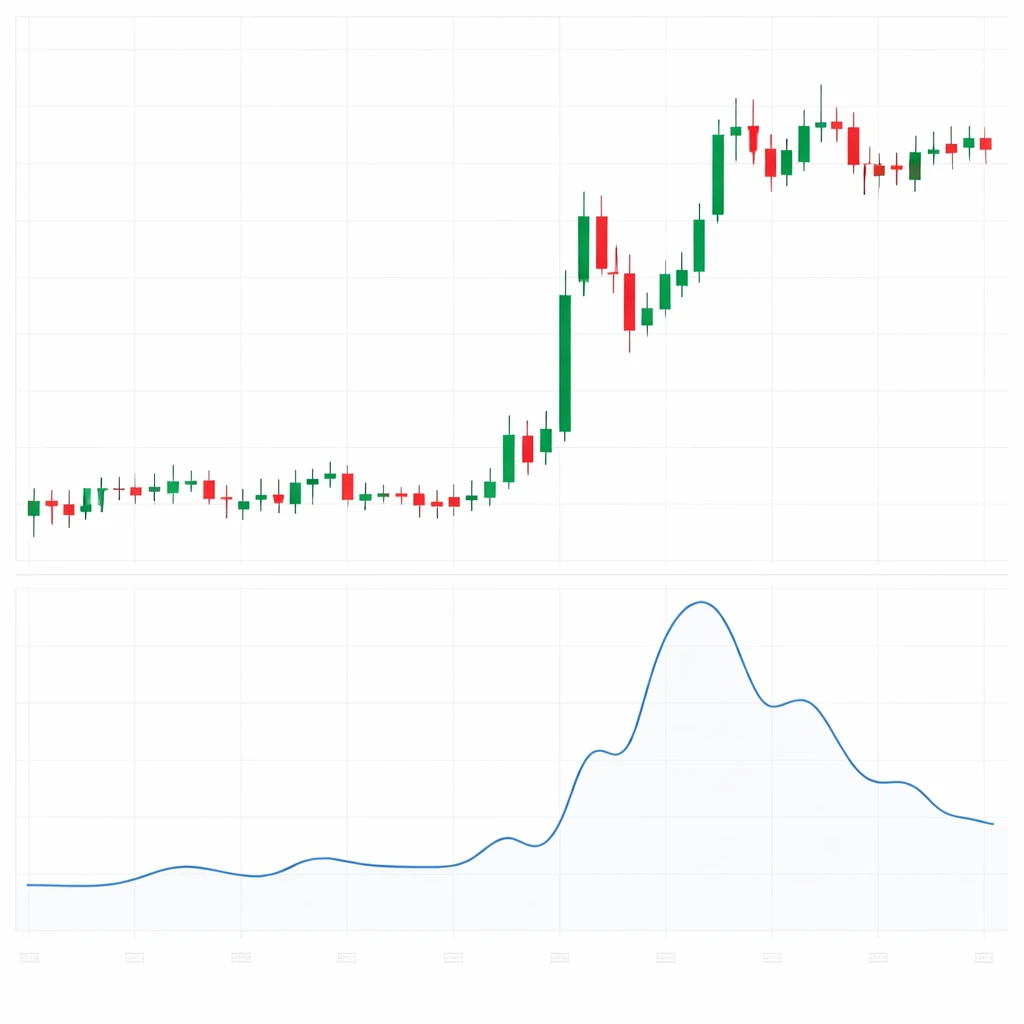
How ATR Appears on Charts
Most platforms plot ATR as a single continuous line in a subpanel below price. The vertical scale uses the instrument’s price units. If a stock trades near 50, an ATR reading of 1.20 means the typical daily move in recent sessions has been about 1.20 points. In foreign exchange, ATR might be quoted in decimals that correspond to pips. For example, an ATR of 0.0060 in EURUSD corresponds to about 60 pips. The line often appears smooth because it is an average. Sharp one day spikes in True Range tend to be tempered by the smoothing process, though a very large shock will still pull the ATR line higher.
On candlestick charts, these dynamics are easy to see. Quiet consolidation often coincides with a gently declining ATR line. A large gap, a long range bar, or several active sessions typically pulls the ATR line higher.
Why Practitioners Watch ATR
ATR is monitored because it provides a compact description of the current volatility environment. The indicator serves several interpretive roles:
- Regime awareness: shifts in ATR help distinguish quiet from active conditions, which affects how analysts interpret patterns, support and resistance significance, and the likelihood that small fluctuations are noise.
- Context for price moves: a one point move carries different meaning when ATR is 0.25 versus when ATR is 2.50. The same absolute move can be ordinary in a high volatility regime and unusual in a low volatility regime.
- Event impact assessment: ATR incorporates gaps, so it quickly reflects the impact of earnings announcements, macro data, policy decisions, or other catalysts that expand or compress trading ranges.
- Cross market translation: because ATR is in price units, analysts can convert it to a percentage of price to compare volatility across assets or across time for the same asset.
These uses do not depend on predicting direction. They rely on measuring variability to provide context for analysis and communication.
Step by Step Numerical Illustration
Consider a simplified five day sequence for a stock quoted in points. Prices are adjusted for splits and dividends to avoid artificial gaps. Suppose the following daily values:
- Day 1: High 51.2, Low 49.8, Close 50.5
- Day 2: High 51.0, Low 49.9, Close 50.1
- Day 3: High 51.7, Low 50.0, Close 51.5
- Day 4: High 52.1, Low 50.7, Close 50.9
- Day 5: High 51.3, Low 49.6, Close 50.0
Compute True Range for each day. For Day 1 there is no prior close, so TR can be set to High minus Low, which is 1.4. For Day 2, consider the three candidates: High minus Low equals 1.1; absolute value of High minus prior Close equals absolute value of 51.0 minus 50.5 equals 0.5; absolute value of Low minus prior Close equals absolute value of 49.9 minus 50.5 equals 0.6. The maximum is 1.1, so TR is 1.1. Continue similarly:
- Day 3: High minus Low equals 1.7; absolute H minus prior C is 1.6; absolute L minus prior C is 0.1. TR is 1.7.
- Day 4: High minus Low equals 1.4; absolute H minus prior C is 0.6; absolute L minus prior C is 0.8. TR is 1.4.
- Day 5: High minus Low equals 1.7; absolute H minus prior C is 0.4; absolute L minus prior C is 1.3. TR is 1.7.
If we used a 5 period simple moving average of TR for this illustration, the ATR on Day 5 would be the average of [1.4, 1.1, 1.7, 1.4, 1.7], which equals 1.46 points. Using Wilder’s smoothing with n equal to 5 would give a similar result but with a recursive calculation after the initial average. In either case, the interpretation is straightforward. During this week the typical daily movement was around one and a half points.
ATR in Different Timeframes
ATR can be computed on any timeframe that has high, low, and close. Intraday charts use bars such as 1 minute, 5 minute, 15 minute, or 1 hour. Daily, weekly, and monthly ATR are also common. The timeframe determines the horizon of variability captured by the indicator.
Two considerations are helpful when interpreting ATR across timeframes:
- Sampling of events: daily ATR captures overnight gaps that intraday ATR might ignore if computed within a continuous session. If overnight events are material for a market, daily ATR will better reflect that impact.
- Nested variability: a quiet week can contain several active intraday sessions. A multi timeframe view can reveal that dynamic. Weekly ATR may be subdued while 5 minute ATR shows bursts during scheduled announcements.
Because ATR is backward looking and smoothed, changes in volatility often appear in the lower timeframe ATR first, then propagate into the higher timeframe as the new information accumulates.
ATR and Price Level Scaling
ATR increases naturally as price levels rise and decreases as price levels fall, even if percentage volatility stays the same. This property can complicate comparisons across assets or across time. Two simple adjustments are common in analysis:
- ATR as a percentage of price: divide ATR by the current close (or by a moving average of price) to obtain a dimensionless measure. For example, an ATR of 1.50 on a 50 unit stock is 3 percent, while an ATR of 3.00 on a 200 unit stock is 1.5 percent. The percent version enables cross sectional comparisons.
- Unit interpretation: for instruments quoted in pips or ticks, it is often clearer to express ATR directly in those units. A 60 pip ATR in a currency pair provides an intuitive scale for daily variability.
Neither adjustment changes the underlying concept. They simply help with communication and cross market analysis.
Relationship Between ATR, Volume, and Market Activity
ATR focuses on price variability. Volume measures how much was traded. The two often move together during major events, but the relationship is not fixed. It is possible to see high volume with modest ATR if activity is concentrated near a price level. It is also possible to see high ATR with restrained volume in thin or fragmented markets.
Analysts sometimes compare changes in ATR with changes in volume to gauge whether expanding ranges are accompanied by heavier participation. That comparison can help diagnose whether a volatility expansion is broad based or driven by a smaller group of trades. The interpretation remains descriptive rather than prescriptive. Volume and ATR summarize different dimensions of market behavior, and each can shift for reasons unrelated to the other.
ATR in Context: Typical Chart Scenarios
Although ATR is not a timing tool, it provides useful context in several recurring situations:
- Quiet consolidation: after a prolonged directional move, prices may enter a narrow range while participants reassess information. Intraday highs and lows compress, gaps diminish, and ATR slopes downward.
- Event induced shock: following a major announcement, price may gap and produce long range bars. True Range spikes, and ATR begins to climb as the smoothing incorporates successive large values.
- Volatility clustering: activity often arrives in clusters. After an initial spike, elevated True Range can persist for several sessions even if price direction alternates. The ATR line remains elevated before gradually easing.
- Post spike decay: a single extreme day without follow through will pull ATR higher briefly. If subsequent sessions revert to quieter trading, ATR decays as the large observation rolls out of the window.
In each scenario, the ATR line functions as a running summary of how forceful price swings have been in recent periods.
Practical Example Using Realistic Magnitudes
Imagine an index future that has traded for months with a daily ATR near 18 points. Over a week of policy uncertainty, the market posts a 45 point gap followed by several wide range sessions. True Range values of 40 to 60 points appear repeatedly. The 14 day ATR begins to rise from 18 toward 35 and then toward 42 as the cluster persists. During this interval, a one day move of 25 points, which previously would have been exceptional, becomes relatively ordinary by comparison. The change in ATR communicates that the market’s typical swing size has roughly doubled. When the catalyst passes and daily ranges shrink, the ATR declines back toward its prior baseline, though with some lag because of the smoothing.
Consider a different example in foreign exchange. A currency pair trades near 1.2000 with a 14 day ATR of 0.0040, approximately 40 pips. Following a central bank meeting, intraday ranges expand and several days record True Range near 0.0100. The ATR rises toward 0.0070. For an analyst discussing price behavior with colleagues, it becomes natural to describe daily movement as roughly 70 pips rather than 40 over this episode. The absolute scale has shifted, even if the market alternates up and down within that expanded band.
Parameter Selection and Smoothing Choices
Wilder used a 14 period lookback because it struck a balance between responsiveness and stability across daily commodity data. The appropriate window depends on the horizon an analyst wishes to summarize. Short windows amplify sensitivity to fresh information but also to transient noise. Long windows dampen noise and increase lag.
The choice of smoothing method also shapes the line. Wilder’s recursive formula is effectively an exponential smoothing with a decay parameter of 1 divided by n. A simple moving average weights all n observations equally and replaces the oldest value entirely when a new value arrives. An exponential moving average puts more weight on recent True Range and less on the distant past, yielding a line that adjusts faster to changes. These are implementation choices rather than conceptual changes.
ATR, Standard Deviation, and Historical Volatility
ATR is often compared with standard deviation based volatility measures. The two are related but not interchangeable.
- Direction neutrality: both aim to capture variability without regard to direction. Standard deviation looks at dispersion of returns around a mean. ATR looks at typical absolute price range.
- Gaps and tails: ATR fully incorporates gaps by construction. Standard deviation computed from close to close returns may understate the impact of intraday highs and lows unless high frequency data is used.
- Units and scaling: ATR is expressed in price units, which is intuitive but not directly comparable across assets. Standard deviation of returns is unitless and can be annualized using time scaling assumptions.
- Sensitivity to microstructure: ATR uses highs and lows, which can be affected by intraday volatility and quote noise. Standard deviation of daily closes ignores intraday extremes but can miss important information about trading ranges.
Each measure provides useful information. ATR is simple, transparent, and closely aligned with the experience of looking at bars on a chart. Standard deviation based measures connect more directly to probability models and are commonly used in risk management frameworks. Analysts frequently use both to triangulate a coherent view of variability.
Limitations and Data Considerations
Like any indicator, ATR has limitations that matter for interpretation.
- Lag: ATR is an average of past True Range, so it responds with delay to sudden regime shifts. Very short windows reduce lag but increase noise.
- Lack of direction: ATR does not indicate whether prices are trending. It can increase during both advances and declines, and it can remain high during choppy periods.
- Scale dependence: without normalization, ATR levels are not comparable across assets or across very different price levels for the same asset. Converting to ATR as a percentage of price helps if cross comparison is necessary.
- Event artifacts: corporate actions, especially unadjusted cash dividends and splits, can create artificial gaps in equities. Using adjusted data is important to avoid overstating True Range on ex dates.
- Market microstructure: thinly traded instruments may print sporadic highs or lows that inflate True Range. Filters or quality checks on intraday extremes can reduce distortion.
- Session differences: markets with defined sessions and overnight gaps will show different ATR behavior than continuous futures or crypto markets. Overnight risk that materializes in gaps is fully counted by True Range.
Interpreting Changes in ATR
ATR tends to exhibit clustering. Elevated values often persist as information is processed, then fade as uncertainty resolves. Analysts sometimes segment ATR history into regimes, not to predict transitions, but to understand whether the market is behaving in a manner consistent with past high or low volatility phases. When ATR shifts from a low plateau to a higher plateau, it suggests that recent price action has become more forceful. When ATR compresses for an extended period, it indicates that price has been moving within narrower boundaries.
Because ATR is unit based, it is often paired with a percent conversion when the goal is to evaluate whether current variability is unusual relative to the asset’s own history. This avoids confusion between price level changes and true changes in volatility.
Communicating with ATR
ATR provides a common language for describing market activity. Phrases such as the current 14 day ATR is about 1.8 points or recent daily variability has run near 70 pips are concise and informative. They enable comparisons of episodes within the same instrument and help frame how surprising a given day’s movement is relative to the recent environment.
Summary Perspective
Average True Range is a straightforward, robust indicator that transforms the visual impression of wide or narrow bars into a consistent quantitative summary. It incorporates gaps, adapts to different timeframes, and communicates in familiar price units. While it cannot state where price will go, it clarifies how forcefully price has been moving. Used thoughtfully, ATR improves the clarity of chart analysis and the precision of language around volatility, without implying a directional view.
Key Takeaways
- ATR measures recent price variability in absolute terms by averaging True Range over a chosen window.
- True Range captures both intraperiod ranges and gaps, making ATR sensitive to events that occur between closes.
- ATR is plotted as a single line beneath price and rises in active markets while falling in quiet markets.
- Because ATR is expressed in price units, converting it to a percentage of price can help with cross asset comparisons.
- ATR is descriptive rather than predictive. It provides context for interpreting market behavior but does not indicate direction.