Overview
Trend is a foundational concept in technical analysis. It describes the directional bias of price over a defined period, distilled from the sequence of swings that markets form as they move. Practitioners assess whether price is advancing, declining, or moving sideways by examining the relationship between successive swing highs and swing lows. This article focuses on two primary states: uptrends and downtrends. The goal is to clarify what these terms mean, how they appear on charts, and why the structure of price swings helps interpret market behavior without prescribing strategies or recommendations.
At its core, an uptrend reflects persistent buying pressure strong enough to push price to new highs after pullbacks. A downtrend indicates persistent selling pressure that pulls price to new lows despite intermittent rallies. Understanding this structure improves the ability to recognize context. It does not forecast outcomes and it does not guarantee continuation. It helps organize information so that what appears as noise on short horizons can be placed within a broader price narrative.
Defining Uptrends and Downtrends
The standard textbook definitions are concise and visual. An uptrend is a series of higher highs and higher lows. As price advances, it sets a new peak that exceeds the prior peak, then pulls back to a low that remains above the prior low, and advances again. A downtrend reverses the logic. It is a series of lower highs and lower lows. Price sets a low below the prior low, rallies to a high that remains below the previous high, then declines again. The sequence matters because it reflects the balance of pressure between buyers and sellers.
What counts as a swing high or swing low
A swing high is a local maximum, typically formed when price rises over several bars then turns down, leaving a peak that is higher than neighboring bars. A swing low is a local minimum formed when price declines over several bars then turns up, leaving a trough that is lower than neighboring bars. Different traders use slightly different bar counts to define a swing. The essential point is consistency. Once the definition is fixed for a given chart, higher highs and higher lows, or lower highs and lower lows, can be identified with fewer subjective judgments.
How many swings define a trend
A single higher high does not establish an uptrend. The minimum useful threshold is typically two higher highs and two higher lows for an uptrend, or two lower highs and two lower lows for a downtrend. This requirement reduces the chance of mislabeling a brief spike as a trend. Even then, trend labeling is conditional. Further price action can negate a label by breaking the pattern of swings.
How Trends Appear on Charts
Charts render trends as a staircase of impulses and corrections. In an uptrend, the impulses to the upside are often longer or faster than the pullbacks, and pullbacks tend to stall above prior swing lows. In a downtrend, declines often dominate, and rallies stall below prior swing highs. The pattern does not unfold perfectly. Markets gap, consolidate, and react to new information. The structure focuses attention on the relationship between successive pivots rather than on any single bar.
Three visual properties commonly stand out:
- Slope and angle: Uptrends display an upward slope over the observation window. Downtrends slope downward. The steepness can vary with volatility and the timeframe.
- Relative depth of pullbacks: In healthy uptrends, pullbacks are often shallow to moderate relative to the prior advance. In strong downtrends, countertrend rallies are similarly constrained.
- Overlap: Trends with limited overlap between successive swings look cleaner. Heavy overlap can signal consolidation or a transition toward a range.
Candlestick or bar charts make this structure visible in fine detail. Line charts connecting closing prices can also be useful when eliminating intraday noise is desirable. Each representation has trade-offs. Candlesticks reveal intrabar extremes that may define swings more precisely. Line charts simplify the visual field and highlight the path of closing prices.
Tools for Visualizing Trends
Trend identification relies on price, but several simple tools help visualize structure and encourage consistency.
- Trendlines: In an uptrend, a rising trendline can be sketched by connecting at least two higher swing lows. In a downtrend, a falling trendline can be drawn by connecting at least two lower swing highs. A third touch strengthens the line’s descriptive value. A trendline is not definitive evidence of continuation or reversal. It is a guide that translates the sequence of swings into a geometric object.
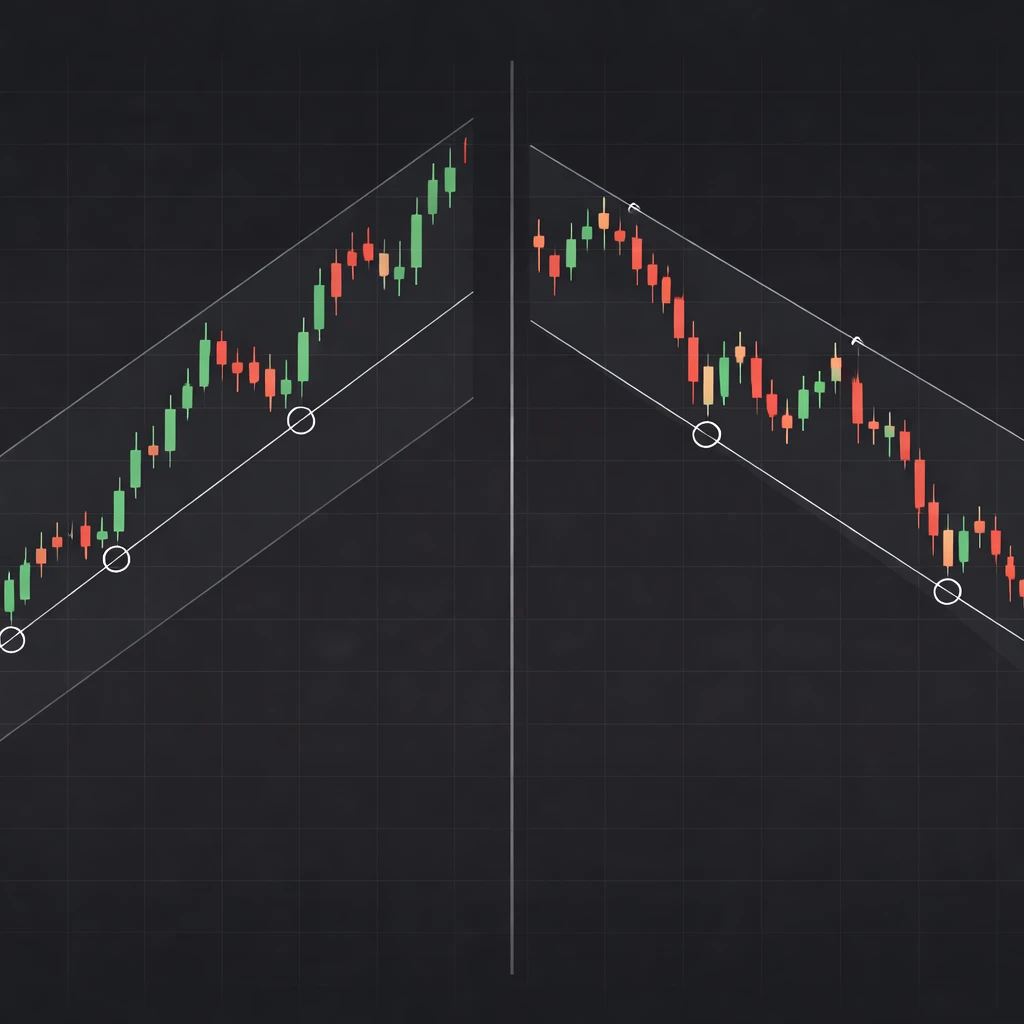
- Price channels: A channel pairs a trendline with a parallel line on the other side of price action. In an uptrend, the channel top often contains swing highs while the lower boundary traces swing lows. Channels make it easier to compare the length and speed of pushes within the trend.
- Moving averages: A moving average smooths price, which can help observe whether price tends to remain above a rising average in an uptrend or below a falling average in a downtrend. This is descriptive, not prescriptive. The average does not define the trend. Price structure defines the trend, and the average can be used as a visual scaffold.
- Structure labels: Marking swings with HH (higher high), HL (higher low), LH (lower high), and LL (lower low) reduces ambiguity. Labels promote a systematic reading from left to right and discourage impulsive relabeling when volatility increases.
Market Structure Within Trends
Trends are not straight lines. They are composed of alternating segments with different characteristics. A useful taxonomy separates swings into impulse and corrective phases. An impulse advances in the direction of the trend with relatively stronger momentum and often with wider bars or larger bodies on candlesticks. A corrective move travels against the trend with relatively slower momentum and greater overlap. The impulse-corrective rhythm gives a trend its cadence.
Uptrend structure
In an uptrend, the prior swing low often acts as a structural reference. As long as price advances to a higher high after each pullback and the pullback does not breach the prior swing low, the uptrend persists by definition. When a pullback falls below the last swing low, the market has broken the sequence of higher lows. That break is a structural warning. It does not instantly create a downtrend, but it marks a change in character that requires a new higher high to repair the structure or a lower high followed by a lower low to complete a transition.
Downtrend structure
In a downtrend, the prior swing high plays the role of structural reference. As long as price declines to a lower low after each rally and rallies fail beneath the prior swing high, the downtrend persists. A rally that breaks the prior swing high is a structural warning that the sequence of lower highs has been interrupted. A subsequent higher low followed by a higher high would complete a transition to an uptrend. If the rally fails and a lower low forms, the downtrend reasserts itself.
Consolidation within trends
Even persistent trends often pause in ranges. Consolidations form when impulse and corrective swings become similar in size and overlap heavily. From a structural perspective, ranges are neutral zones where neither side controls the sequence of swings. A break from a consolidation can resume the prior trend or begin a transition toward the opposite trend. Recognizing a consolidation prevents over-interpreting noisy fluctuations as trend continuation or reversal prematurely.
Timeframes and Fractal Nature
Trends are timeframe dependent. A daily uptrend can coexist with an intraday downtrend, and a weekly downtrend can contain multiple daily uptrends. This layered behavior is sometimes described as fractal. The same structural rules apply on each timeframe, but the significance assigned to a break or continuation depends on the timeframe under examination.
Two practical implications follow. First, always specify the timeframe when describing a trend. Saying that a market is in an uptrend is incomplete without noting whether this applies to the 5-minute chart, the daily chart, or the monthly chart. Second, be aware that opposing trends across timeframes are common. Short-term pullbacks against a weekly uptrend can be full downtrends on an hourly chart. Clarity comes from keeping definitions consistent within each timeframe and avoiding the temptation to merge timeframes without a clear framework.
Transitions Between Uptrends and Downtrends
Transitions are rarely instantaneous. They often proceed through a sequence: loss of momentum within the prevailing trend, violation of a key swing level, formation of an opposing swing sequence, and only then a matured trend in the new direction. Several points improve the quality of interpretation.
- Momentum fades before structure breaks: Bars may narrow, overlaps may increase, and corrective moves may deepen. None of this changes the trend label until a prior swing is broken, but it provides early evidence that the advance or decline is tiring.
- Single conditions are insufficient: A trendline break or a moving average cross is not the same as a structural change. Structure changes when the sequence of swings changes. A new lower low after a lower high is needed to change from uptrend to downtrend. A new higher high after a higher low is needed to change from downtrend to uptrend.
- Retests are common: After breaking a key swing point, price often revisits the area. Whether the retest holds or fails provides information about the balance of pressure. The retest itself does not guarantee a specific outcome.
These stages should be read as descriptive possibilities, not as prescriptions. Markets can gap through multiple reference points without any retest, or they can oscillate around a boundary for an extended period.
Practical Chart-Based Context
The following examples are narrative descriptions intended to mirror what a chart might show. They illustrate how an analyst could label swings and interpret structure without implying any trading actions.
Example 1: An equity index in an uptrend
Consider a large equity index that bottoms at 3,500 after a sharp decline. Price advances in five sessions to 3,720, then pulls back over three sessions to 3,640. The subsequent advance pushes to 3,860, then corrects to 3,760, then advances to 4,000. Labeling the sequence shows higher highs at 3,720, 3,860, and 4,000, and higher lows at 3,640 and 3,760. The pullbacks are moderate and do not undercut the prior swing lows. The structure fits the definition of an uptrend on this timeframe.
Later, price consolidates between 3,960 and 4,020 for several sessions. Overlap increases and the slope flattens. Eventually, price breaks above 4,020 and extends to 4,120, then pulls back only to 4,050 before making a new high at 4,200. The consolidation acted as a pause within the uptrend rather than as a top. None of this required prediction. The story is told by the maintained sequence of higher highs and higher lows and the inability of pullbacks to break key swing lows.
Suppose the market then drops from 4,200 to 4,080, rallies to 4,150, and drops to 4,000. The decline to 4,080 did not break the prior swing low at 4,050, but the drop to 4,000 did. That break introduces a structural warning. If price rallies next only to 4,060 and fails beneath the prior rally high at 4,150, then falls below 4,000 to 3,940, the sequence is now a lower high followed by a lower low. The daily uptrend would be considered over, replaced by a downtrend on that timeframe. This example shows how transitions require more than a single line break or a sharp bar. The sequence of swings is central.
Example 2: A currency pair in a downtrend
Imagine a currency pair that tops at 1.2200 and sells off to 1.2050. A bounce to 1.2140 fails beneath the prior high, and the next decline reaches 1.1980. The swing structure shows a lower high at 1.2140 and a lower low at 1.1980. The downtrend continues with a rally to 1.2060, then a decline to 1.1920, then a rally to 1.1980 that fails beneath the prior rally high, and finally a drop to 1.1850. The sequence is clean and consistent: lower highs and lower lows.
After several weeks, the pair rallies through 1.1980 to 1.2070, which breaks the prior swing high. That is a structural warning that the downtrend is weakening. If price then pulls back to 1.2010 and rises to 1.2100, the sequence has shifted to a higher low followed by a higher high, signaling an uptrend on this timeframe. If instead the rally fails and price returns to set a new low, the downtrend reasserts itself. Again, the labeling is descriptive. It does not instruct an action. It organizes the evidence that confirms or negates a trend label.
Why Traders Pay Attention
Trend labels provide a common language for describing market context. Several practical benefits follow from this shared framework, independent of any strategy.
- Clarity amid noise: Markets produce constant fluctuations. Identifying the prevailing sequence of swings filters noise and highlights whether price is generally moving with buyers or sellers in control.
- Reference points: Prior swing highs and lows serve as objective landmarks. Observers can monitor whether price respects or violates those landmarks to gauge changes in character.
- Comparability across instruments: The definitions of higher highs and higher lows or lower highs and lower lows apply to equities, futures, currencies, and many other markets. This standardization improves communication and analysis.
- Framework for risk discussion: Even without making recommendations, trend structure helps frame conversations about where price has accelerated, paused, or reversed. It supports scenario analysis without forecasting.
- Context for complementary tools: Many indicators are sensitive to trend conditions. Knowing whether a market is trending or ranging helps interpret indicator behavior as descriptive context rather than as isolated signals.
Common Pitfalls and Misinterpretations
Several errors recur when reading trends.
- Overreliance on single events: A trendline break, a gap, or a dramatic bar is not sufficient to relabel a trend. Structure changes when the swing sequence changes.
- Ignoring timeframe context: A countertrend move on a higher timeframe can be a full trend on a lower timeframe. Misalignment between timeframes can create confusion if they are not explicitly separated.
- Constantly redrawing definitions: Changing swing definitions mid-analysis to fit a desired label undermines the method. Pick a consistent swing definition for the chart at hand.
- Equating trend with speed: Fast moves are not necessarily trends. A brief spike can fade quickly without producing the required sequence of higher highs and higher lows or lower highs and lower lows.
- Forcing symmetry: Real trends are uneven. Expect irregular pullbacks, failed tests, and periods of consolidation. Seeking textbook perfection can lead to misclassification.
Limitations and Caveats
Trends simplify complex behavior. They help describe what has happened and what the current structure looks like, but they do not explain all drivers of price. News shocks, liquidity events, and structural breaks can alter the path sharply. In addition, different instruments express trends differently. Equity indices often trend with relatively steady corrections due to diversification effects. Individual equities can gap frequently around earnings or events. Currency pairs can chop within ranges for extended periods due to macroeconomic balance. Commodities may trend seasonally or react to inventory data with abrupt jumps.
Subjectivity is inevitable, even with consistent swing definitions. Two analysts can interpret the same chart differently when price is near a boundary between a trend and a consolidation. The most dependable way to reduce this subjectivity is to anchor analysis to explicit swing points, label them, and assess changes using the same rules each time. That discipline makes disagreements transparent rather than arbitrary.
Observational Discipline
Because trend labels are descriptive, a careful analytical routine is useful. On the selected timeframe, identify swing highs and lows using a consistent bar-count or pivot rule. Mark higher highs and higher lows or lower highs and lower lows. Note where price currently sits relative to the most recent swing reference. If structure breaks, record how it broke and whether subsequent swings established a new sequence or reverted to the prior one. These steps do not prescribe what to do. They underpin a standardized description that can be reviewed later for accuracy and clarity.
Integrating Trends With Broader Market Structure
Trends gain meaning when placed within a broader context that includes ranges, breakouts, failed breakouts, and volatility regimes. For instance, a trend that emerges from a long consolidation often begins with a burst of volatility as price re-prices to new information. A late-stage trend can exhibit divergence between price and measures of momentum, more frequent failed pushes, and deeper corrections. None of these traits alone changes the label, but together they color the narrative of how the trend is aging.
Market structure also interacts with liquidity. In thinly traded instruments, swings can be distorted by wider spreads and lower depth. In heavily traded indices, swings can be smoother but may respond sharply to macro releases. Understanding the instrument’s typical behavior helps calibrate expectations about what an impulse or a correction usually looks like on that chart.
Reading Charts: A Simple Procedural Example
The following is a procedural illustration of how an analyst might approach a blank chart without adding indicators, strategies, or recommendations.
- Choose the timeframe to analyze. Assume the daily chart.
- Identify swing points using a consistent rule. For example, mark a swing high when the high is greater than the highs of the two bars on either side, and mark a swing low when the low is less than the lows of the two bars on either side.
- Label the sequence from left to right. If you observe HH at 110, HL at 104, HH at 116, HL at 108, then the market is in an uptrend on this chart.
- Monitor the last labeled swing. If a pullback breaks below 108, record that the most recent higher low has been violated. This is a structural warning that requires further observation.
- Wait for new swings to form. If a lower high forms at 112 followed by a lower low at 102, the sequence has shifted to a downtrend. If instead price makes a higher high at 118, the uptrend remains intact.
These steps demonstrate how structure evolves and how labels can be updated methodically. The emphasis stays on description, not on prescription.
Summary Perspective
Uptrends and downtrends are not forecasts. They are coherent summaries of how buying and selling pressures have resolved over a period. Defined through higher highs and higher lows or lower highs and lower lows, trends provide a disciplined vocabulary for discussing price behavior. They guide attention to the relationship between swings, the presence of pauses, and the conditions under which transitions occur. The value of the concept lies in consistent application and in the restraint to let the swing sequence carry the narrative rather than isolated bars or indicators.
Key Takeaways
- An uptrend is defined by higher highs and higher lows. A downtrend is defined by lower highs and lower lows.
- Swing highs and lows provide the objective landmarks that determine trend structure on any timeframe.
- Trendline breaks or single dramatic moves do not change the trend label unless the swing sequence changes.
- Transitions typically involve momentum fading, a structural violation, and then a new opposing sequence.
- Trend analysis is descriptive context that organizes price behavior without prescribing actions or recommendations.