Overview
Markets rarely move in straight lines. Even strong directional phases alternate with pauses, consolidations, and shifts in momentum. Trend transitions describe the way an established trend loses dominance, passes through a balancing phase, and often re-emerges in the same or opposite direction. Understanding these transitions is central to interpreting market structure because it links swing highs and lows, volatility, and participation into a coherent narrative of changing control between buyers and sellers.
Technical analysis approaches this subject through observed price behavior. Charts reveal patterns in how highs and lows form, how momentum propagates, and how volatility compresses or expands across time. The objective here is not to prescribe a trading strategy, but to define the concept clearly, show how it appears on charts, explain why many market participants study it, and provide practical context for analysis.
Defining Trend Transitions
A trend is a directional bias in price movement that persists across a meaningful sequence of swings. In a basic description, an uptrend consists of higher highs and higher lows, while a downtrend consists of lower highs and lower lows. A transition is the process through which one of these directional structures weakens, enters balance, and either resumes in the same direction or reverses into the opposite structure.
Trend transitions can be characterized by several observable components:
- Swing structure: The sequence of pivots that defines whether price is advancing or declining. A transition often begins when price fails to make a new extreme and later violates a prior key swing.
- Momentum behavior: The relative strength of advances compared with pullbacks. Momentum typically decays before a visible structural break.
- Volatility regime: Compression and expansion of trading ranges. Transitions often involve a period of contraction followed by a renewed expansion in the same or opposite direction.
- Participation: Reflected indirectly through volume, breadth, or relative movement among related assets. Transitions frequently align with declining participation in the prior direction.
Importantly, transitions are processes, not single events. A single large candle, a brief news shock, or one indicator crossover does not define a transition by itself. Analysts typically look for a sequence that shows the prior structure failing to propagate.
How Transitions Appear on Charts
Charts express transitions through the way price interacts with prior reference points. While no single pattern is required, a small set of recurring features appears frequently across markets and timeframes.
1. Failure to Expand the Trend
In an uptrend, price moves beyond prior highs with enthusiasm, and pullbacks hold above prior swing lows. A first sign of change is a notable failure to make a higher high after a swing advance. Price may approach a prior high and reject, or it may push slightly above and immediately return below, creating a failed breakout. In a downtrend, the symmetry is reversed. Such failures do not confirm a transition, but they shift attention to the integrity of the most recent swing low or high.
2. Break of Structure
Many practitioners track a concept often called a break of structure. After an uptrend stalls, a subsequent decline that undercuts the most recent swing low signals that buyers no longer defend prior demand zones with the same conviction. In a downtrend, a rally that breaks above a key swing high can carry similar meaning. This is a structural milestone that moves the market from trend into balance or into the early stages of an opposite trend.
3. Range Formation and Rotation
Transitions frequently pass through balance. Price begins to oscillate between a developing high and low, often overlapping prior bars more than before. The range can persist as participants discover fair value after an extended move. Within this balance, rotational behavior becomes more symmetric, with failed attempts in both directions. Ranges can resolve into continuation of the original trend or a full reversal.
4. Volatility Compression and Expansion
Directional phases often show expansion in range on impulses and smaller ranges during pauses. As a trend ages, volatility within swings may compress. Daily ranges narrow, and price closes cluster. After sufficient compression, a significant expansion day or bar often signals that a new phase has begun. Whether that expansion carries the prior trend forward or breaks it depends on where it occurs relative to the developing range boundaries and key swings.
5. Momentum and Divergences
Momentum indicators are descriptive tools that summarize rate of change. When price makes a marginal new high but momentum makes a lower high, or when price makes a marginal new low but momentum makes a higher low, the pattern reflects waning thrust. This divergence does not necessitate a reversal, but it contextualizes the quality of the trend’s extension and is often visible during transitions.
6. Multi-Timeframe Interaction
Transitions on a lower timeframe often begin while the higher timeframe trend still appears intact. For example, a weekly uptrend can enter distribution while the daily chart shows a trading range and the intraday chart breaks structure repeatedly. Analysts commonly map transitions from the bottom up, recognizing that lower timeframe changes may accumulate into a higher timeframe transition.
Why Market Participants Care About Transitions
Transitions have significant interpretive value because they influence risk, narrative, and expectations for variability. When a trend weakens, the distribution of potential outcomes widens. Balance areas can increase mean reversion in the short run, and a later expansion can change directional bias. Portfolio managers and traders often monitor transitions to align exposure with the prevailing regime, to calibrate volatility assumptions, and to evaluate whether recent price paths still match the prior trend’s character. None of this implies a specific trade or recommendation. It simply reflects the analytical importance of identifying when the market stops behaving like a strong trend and starts behaving like a balance or a new trend.
Beyond direction, transitions inform discussions of liquidity and execution. As ranges develop, liquidity often concentrates around the center of the balance, with thinner liquidity near the edges. Directional expansion tends to shift liquidity to new areas. Understanding this ebb and flow helps explain slippage, gap risk around earnings or macro events, and why similar price levels can provoke different reactions at different stages of the transition.
Phases of a Typical Transition
Not every market follows the same script, but many transitions share a loose sequence of phases. The labels are descriptive, not prescriptive.
Phase 1: Maturation of the Existing Trend
In late-stage uptrends, advances may become shorter in distance and time, and pullbacks may deepen. Overlapping bars increase. The slope of moving averages can flatten, although this is a secondary summary rather than a cause. Volume can rotate from strength on rallies to more balanced activity. New highs become less convincing and occur on narrower ranges. Analogous behavior appears at the end of downtrends.
Phase 2: Initial Structural Challenge
Price fails to extend meaningfully beyond a prior swing and then returns to test a reference low or high. A decisive penetration of that level marks a structural challenge. The market often responds with heightened two-sided trade, as participants who anchored to the prior trend reassess risk and those anticipating change attempt to establish the new narrative.
Phase 3: Balance and Discovery
The market explores a range in which neither side demonstrates persistent control. Triple tests of the same high or low are common, as are false breakouts that immediately revert. Volume can cluster in the middle of the range, while tails or wicks accumulate near the extremes. During this phase, analysts evaluate whether rallies or declines within the range show stronger breadth, momentum, or follow-through.
Phase 4: Resolution
Eventually, the balance resolves. A range that breaks in the direction of the prior trend produces continuation. A range that breaks opposite the prior trend produces reversal. The resolution is often accompanied by volatility expansion and may include a retest of the breakout or breakdown area. If the resolution fails quickly, the market can re-enter balance and extend the discovery process.
Practical Chart-Based Context
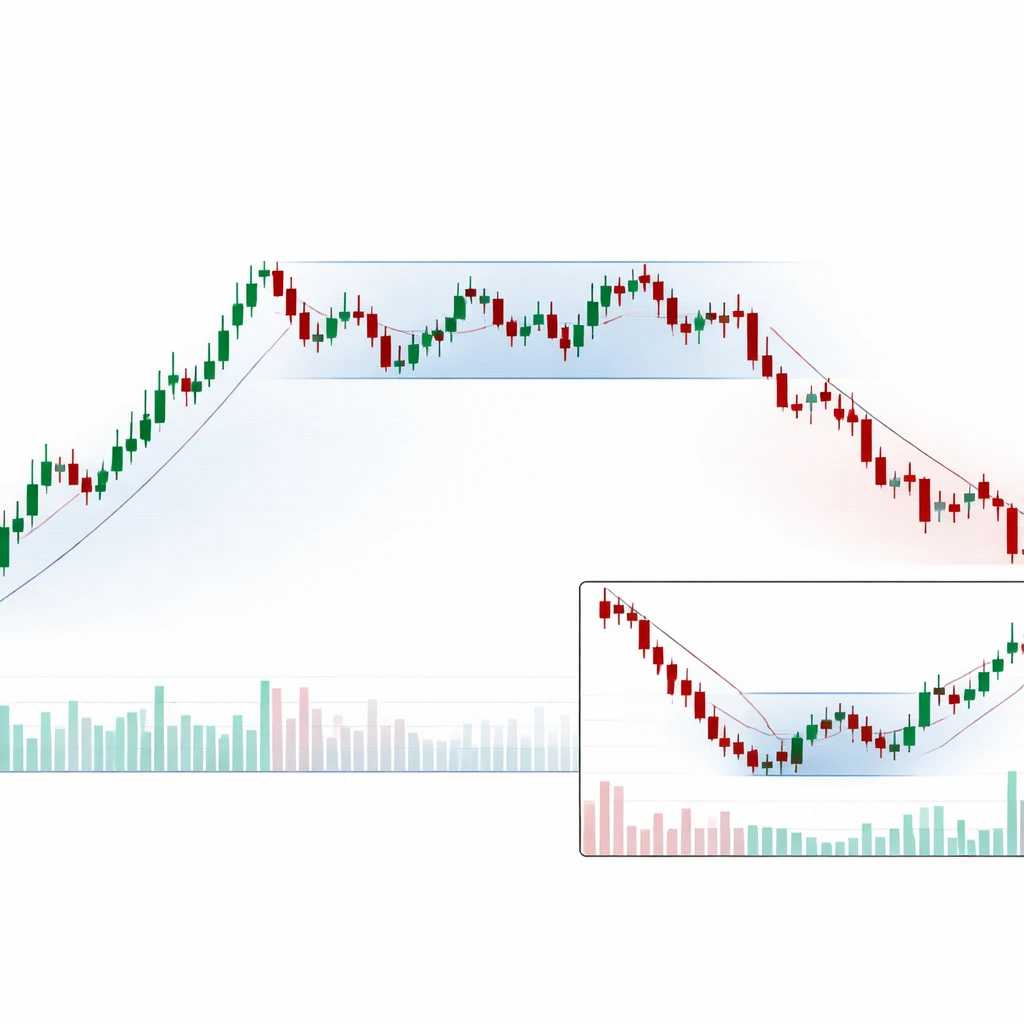
Example A: Uptrend to Balance to Reversal
Consider a large-cap equity on a daily chart that has advanced steadily for several months. The sequence shows clear higher highs and higher lows, with pullbacks restricted to shallow retracements. In late quarter, the stock prints a marginal new high on reduced range and volume compared with prior breakouts. In the following sessions, a pullback undercuts the most recent higher low. This marks a structural change since buyers previously defended that region.
After the break, price oscillates between the former high area and the new swing low, building a balance. Attempts to break above the upper boundary repeatedly fail and close back inside the range. Momentum on rallies lags the earlier trend. Two weeks later, a down day expands the range and closes below the lower boundary, followed by a retest from below that fails to reclaim the range. The market has transitioned from uptrend to balance to downtrend. None of these observations imply a trade instruction. They illustrate how the process can unfold visually.
Example B: Downtrend Losing Pressure on Intraday Timeframe
On a 15-minute future’s chart during a macro news day, price trends lower in the morning with consistent lower highs and lower lows. Midday, the downswings shorten, and the rebounds travel farther before stalling. A final push to a new low is immediately rejected with a large counter-move that closes back above the prior lower high, creating a structural violation on this timeframe. Price consolidates in a tight range for an hour, then expands upward, forming the first higher low in the sequence. By the close, the chart shows a clear change in character, even though the daily chart may still be in a downtrend. This example highlights the fractal nature of transitions and the importance of timeframe context.
Distinguishing Pullbacks from Transitions
One challenge in practice is separating a normal pause from the early stages of a transition. Both involve counter-trend movement and both can appear after strong runs. Several features help contextualize the difference without claiming certainty.
- Depth and duration: Pullbacks in healthy trends tend to be relatively shallow and brief. When counter-moves deepen and persist, the odds increase that the structure is changing.
- Location: A pullback that stays above a prior swing low in an uptrend, or below a prior swing high in a downtrend, maintains the structural definition of the trend. Penetration of those references challenges the trend’s integrity.
- Character of attempts: In an uptrend, rallies from pullbacks should show decisive follow-through. If rallies repeatedly fail to clear nearby resistance and give back gains quickly, that behavior is more consistent with transition.
- Volatility behavior: Pullbacks may carry lower volatility than trend impulses. An abrupt volatility expansion against the prior trend can indicate more than a routine pause.
- Participation: Reduced breadth or waning volume on pushes in the direction of the trend points to diminishing sponsorship.
Analysts often weigh these elements together. No single test determines whether a move is a pullback or a transition. The assessment evolves as additional information emerges.
Analytical Tools for Studying Transitions
While price structure is primary, several descriptive tools can help frame transitions. Listing them here is not an endorsement of a method or a strategy, but a brief review of common techniques used to study the phenomenon.
- Swing mapping: Marking successive swing highs and lows on the chart clarifies when structure shifts from higher highs and higher lows to lower highs and lower lows, or vice versa.
- Trendlines and channels: Lines that connect swing points can display the slope and width of a trend. Breaks of a well-respected line signal a change in rhythm, especially if followed by failure to re-enter the channel.
- Moving averages: The slope and alignment of moving averages summarize trend direction and persistence. Flattening slopes or frequent whipsaws around a flat average often coincide with balance.
- Momentum indicators: Tools such as rate-of-change, RSI, or MACD describe thrust and acceleration. Divergences at potential turning points are common during transitions.
- Volume and breadth: Measures of participation can identify whether advances or declines are broadly supported. Diminishing participation during new extremes is a frequent feature of transitions.
- Volatility measures: Average True Range and realized volatility summarize the regime. Contractions often precede breakouts from balance zones.
- Market profile and value migration: Profile distributions can reveal where trade concentrates. In transitions, value often stops migrating in the direction of the prior trend and begins rotating or shifting the other way.
These tools are best used as descriptive aids. They help interpret what price is doing rather than predict what it must do next.
Common Pitfalls in Interpreting Transitions
Trend transitions are attractive to study because they promise clarity in hindsight. In real time, they are challenging. Several pitfalls recur even among experienced observers.
- Reading too much into a single event: One dramatic bar can be a data point rather than a durable change. Structural shifts usually require a sequence of evidence.
- Ignoring timeframe conflict: A clean transition on a 15-minute chart can be noise on a weekly chart. Always anchor the analysis to the timeframe being evaluated and recognize how multiple timeframes intersect.
- Over-reliance on patterns: Classical formations such as double tops or head-and-shoulders can accompany transitions, but they are not guarantees. The underlying structure and participation matter more than the label.
- Confirmation bias: Seeing a desired reversal in every consolidation leads to premature conclusions. Balanced observation requires tracking both sides of the range and updating the assessment if evidence changes.
- Neglecting context: Earnings, policy announcements, and macro releases can temporarily distort structure. A clean transition can fail if unusual flows dominate the next session.
Transitions and Market Structure
Market structure provides the framework for understanding a transition’s mechanics. In an uptrend, buyers repeatedly accept higher prices, defend higher lows, and shift the perceived value area upward. A transition interrupts this process. First, the market fails to make new value higher. Next, it stops defending higher lows. Eventually, it begins to accept lower prices as normal. The same logic applies in reverse for downtrends.
Liquidity behavior often marks each stage. In late-stage trends, liquidity near the extremes can thin out, leading to slippage or swift rejection moves. During balance, liquidity deepens near the middle of the range as more transactions occur there. During resolution, new price zones become active and liquidity migrates. Observing this flow helps explain why the same price can behave differently as the market’s structure evolves.
Advanced Considerations
Several nuanced topics enrich the study of transitions without dictating specific decisions.
Fractal Nature and Scale
Transitions are fractal. The same broad sequence occurs across minutes, days, and weeks. This implies that evidence on a smaller scale can foreshadow change on a larger one. Conversely, a small-scale transition can exhaust itself within a larger trend that remains intact. Analysts often map transitions on at least two adjacent timeframes to understand how local changes fit within the broader context.
Failed Transitions
Not every break of structure leads to a sustained move. Sometimes a market undercuts a prior swing, attracts responsive flow in the opposite direction, and immediately reclaims the level. This failed transition often traps late respondents and can power a return to the prior trend. The key is not to assume that a single violation defines the process, but to assess whether the market accepts prices beyond the level over time.
Role of Gaps and News
Gaps frequently occur near transitions because information shocks concentrate order flow at new prices. Whether a gap represents a transition depends on what follows. If price accepts the gap area and builds structure around it, the transition is more credible. If the gap is filled quickly and structure remains intact, the event may be less significant than it first appeared.
Sector and Cross-Asset Context
Transitions in a benchmark often coincide with relative strength rotations among sectors or styles. For example, a topping process in a broad index can align with defensive sectors improving on a relative basis while previous leaders underperform. Cross-asset signals, such as changes in rates or credit spreads, can coincide with equity transitions. These relationships are descriptive, not prescriptive, and they are variable across cycles.
Interpreting Without Predicting
Studying transitions is an exercise in interpretation rather than prediction. The aim is to understand what the market is doing, not to insist on what it should do. A balanced approach respects both the possibility of continuation and the possibility of reversal until structure resolves. Clear mapping of swings, consistent reference to prior highs and lows, and attention to volatility and participation help maintain objectivity. Over time, this discipline can improve the quality of analysis during periods when outcomes are most uncertain.
Applying the Concept to Real Charts
When analyzing a live chart for potential transition, the practical steps are observational. Mark the most recent meaningful swing high and swing low that define the current trend. Monitor whether price extends beyond those references with conviction or fails and returns. Note changes in the length and speed of impulses compared with pullbacks. Identify when ranges form and whether range edges attract acceptance or rejection. Observe whether rising or falling periods carry broad participation. These actions do not constitute a strategy; they are part of disciplined chart reading that seeks to align interpretation with evidence.
Many chart platforms allow annotating with rectangles for ranges, arrows for swings, and lines for prior reference levels. Such annotation clarifies the market’s state without implying a forecast. It also helps resist the tendency to overreact to isolated bars by forcing comparisons to the established structure.
Conclusion
Trend transitions are central to understanding market behavior because they connect directional moves, balance zones, and reversals within a single framework. By focusing on structural shifts, volatility regimes, and participation, analysts can read charts with greater clarity. The process is iterative and uncertain in real time, but the visual evidence accumulates. Recognizing that transitions unfold as sequences rather than moments improves the interpretation of price action across timeframes.
Key Takeaways
- Trend transitions describe how markets move from directional control to balance and often into the opposite direction through observable structural sequences.
- On charts, transitions appear as failures to make new extremes, breaks of key swings, range development, and changes in volatility and momentum.
- Analysts monitor transitions to interpret risk, variability, and participation, not to predict exact outcomes or prescribe trades.
- Distinguishing a pullback from a transition involves assessing depth, duration, location relative to structure, volatility behavior, and participation.
- Transitions are fractal, unfold across multiple timeframes, and require a sequence of evidence rather than a single event for robust interpretation.