Overview
In technical analysis, a ranging market is a period when price oscillates between relatively stable highs and lows rather than advancing in a sustained uptrend or declining in a sustained downtrend. Prices fluctuate within a horizontal or near-horizontal band where neither buyers nor sellers achieve lasting control. Understanding this regime is foundational because it shapes how many chart features behave, how volatility clusters, and how market structure evolves before new information or sentiment emerges.
Recognizing ranges helps clarify whether the market is in a state of balance or imbalance. Although trend identification often receives more attention, much of market time is spent consolidating in some form of range. Correctly identifying a range provides context for interpreting price behavior, volatility conditions, and the potential for structural change, without implying any prediction or recommending any course of action.
What Is a Ranging Market?
A ranging market is a price environment characterized by repeated swings between established upper and lower boundaries that hold for a meaningful period. The distance between these boundaries is the range width. The range can be narrowly confined or relatively wide, and it can persist across different timeframes, from intraday sessions to multi-month windows.
The defining elements are:
- Relative horizontal stability of the upper boundary, often called resistance.
- Relative horizontal stability of the lower boundary, often called support.
- Rotational price movement between these boundaries, showing neither a persistent sequence of higher highs and higher lows nor a persistent sequence of lower highs and lower lows.
Ranges are not perfectly horizontal, nor are boundaries perfectly precise. Markets are noisy. Tails, wicks, and brief excursions around the boundaries are common. The idea is to recognize a balanced zone where attempted advances or declines repeatedly stall and revert toward the center of the zone.
How Ranges Appear on Price Charts
On a candlestick or bar chart, a range appears as a sideways corridor where successive swing highs form near a similar level and successive swing lows form near another. Moving averages often flatten, reflecting a lack of directional momentum. The slope of trendlines drawn over multiple swings is close to zero, and oscillators frequently alternate around a central value.
Visual cues typically include:
- A clustering of closes near the middle of the band with recurring reversion toward the center after touching extremes.
- Lower directional volatility than in trending phases, while local volatility inside the range can still be meaningful.
- Repeated tests of boundary zones where price action produces upper or lower wicks, small-bodied candles, or short-lived pushes beyond the boundary that quickly fade.
Ranges can be symmetric, where the midpoint sits roughly halfway between support and resistance, or skewed, where price spends more time near one boundary than the other. Skew can signal an underlying directional bias that is not yet strong enough to create a trend.
Market Structure Inside a Range
Market structure describes how swing highs, swing lows, and consolidation zones relate to each other. In an uptrend, structure typically shows higher highs and higher lows. In a downtrend, lower highs and lower lows dominate. Inside a range, structure alternates. A local rally that fails at resistance and a subsequent decline that holds above support exemplify balance, not dominance.
From a microstructure perspective, a range reflects a temporary agreement about value. Buyers are willing to transact near the lower boundary and become scarce near the upper boundary. Sellers accept prices near the top and step back near the bottom. Liquidity providers and inventory-sensitive participants tend to be active in such environments, narrowing or widening spreads as conditions change. The resulting auction oscillates around a perceived fair zone until new information shifts expectations.
Why Ranging Conditions Matter
Ranges matter because they filter interpretation. Analytical conclusions drawn in a trend may not translate to a range. For example, momentum readings that look strong in a trend can be commonplace noise in a range. Likewise, a breakout attempt near resistance has a different informational content when the market has repeatedly failed at that level.
Several practical reasons explain the attention given to ranges:
- Context for volatility. Ranges often coincide with lower directional volatility and reduced slope in trend measures. That context shapes how risk is perceived and how sudden expansions in volatility are interpreted.
- Price discovery. Consolidation suggests ongoing negotiation about value. The price band captures the current consensus region where supply and demand regularly rebalance.
- Transition zones. Many directional moves begin or end near prior ranges. Observing how price behaves at the boundaries can provide evidence of changing conditions.
- Comparability across assets. Range analysis applies to equities, fixed income, currencies, and digital assets. Although microstructure varies, the concept of balance versus imbalance is universal.
Common Range Variations and Edge Cases
Not all ranges are neat rectangles. Several variations occur in practice. Recognizing them improves interpretation.
Clean Horizontal Range
This is the textbook version. Support and resistance lie on nearly flat lines. Price rotates with modest variance around a visible midpoint. The width remains stable, and boundary tests are frequent.
Expanding Range
Also called a broadening formation, this pattern displays higher highs and lower lows that gradually widen the band. Despite the widening, the center of gravity may still be flat. Expanding ranges often reflect uncertainty with rising realized volatility.
Contracting Range
Sometimes referred to as a volatility contraction, the boundaries slowly converge. The market appears to compress around a central value as realized volatility decreases. Candles narrow, and intraday excursions shrink.
Drifting Range
A range can slope gently while still behaving like a balance area. The structure remains rotational, but support and resistance tilt slightly upward or downward. The drift is slow enough that the market does not exhibit sustained trending behavior.
Stepwise Range
Price can oscillate within a band, then shift to a new band at a higher or lower level, forming a staircase of adjacent ranges. Each step acts as its own balance area, separated by brief directional moves.
False Breaks and Re-entries
Short-lived moves beyond a boundary that quickly re-enter the band are common. These events highlight the practical challenge of defining a boundary as a single line rather than a zone. They also reflect the dynamic nature of liquidity and order flow around key levels.
Timeframe Interactions and Fractal Ranges
Ranges are fractal. A daily chart can be range-bound while a weekly chart trends, or the reverse. On intraday charts, a market can oscillate inside a morning range, break during midday, and establish a new afternoon range within the same overall daily balance.
Three points help organize multi-timeframe analysis:
- Dominant timeframe. Decide which timeframe defines the primary regime under study. A range on a 5-minute chart has different implications than a range on a weekly chart.
- Nesting. Smaller ranges often sit inside larger ones. The bounds of the higher timeframe may govern the broader context while lower timeframes rotate within.
- Alignment and conflict. When multiple timeframes display similar balance areas at comparable levels, boundaries can gain significance. When they conflict, noise and whipsaw risk can increase.
Indicators and Metrics in Ranges
Technical indicators behave differently in ranges than in trends. The following observations do not prescribe any method. They provide descriptive context to understand what charts often show during balance conditions.
Moving averages. During ranges, common moving averages flatten and intertwine with price. Crossings occur more frequently because there is no persistent slope. The location of price relative to a flat average conveys less directional information than it would in a trending regime.
Oscillators. Tools that measure deviation from a central value, such as relative strength or stochastic oscillators, often oscillate around their midlines. Extremes occur near range boundaries more often simply because price revisits those zones repeatedly.
Volatility measures. Average True Range can decline as directionality fades, though realized intraday swings may still be active within the band. Bollinger-style envelopes may contract in narrow ranges and expand when price tests boundaries with larger moves.
Volume and participation. Volume can dry up near the middle of a range and pick up at the edges. Alternatively, volume can remain muted throughout extended consolidations, particularly in assets with low float or limited participation.
Volume, Liquidity, and Order Flow Considerations
Ranges often correspond to areas where market participants are willing to transact repeatedly at similar prices. This shows up as layered limit orders in the order book, clustering near the perceived fair value. Market makers and liquidity providers attempt to manage inventory around these zones. The process narrows spreads in stable conditions and widens them when uncertainty spikes.
When price approaches the upper boundary, liquidity providers may lean on the offer, anticipating mean reversion into the band. When price approaches the lower boundary, activity may shift to the bid. None of this guarantees outcomes. It does highlight how balance areas emerge from the interaction of resting liquidity and market orders.
Public news, scheduled data releases, and large block transactions can disrupt this balance. Liquidity can temporarily vanish at key levels, creating slippage and gaps that carry price to new areas where transactions resume. That is one reason ranges often precede sharp expansions in volatility when significant information arrives.
Catalysts and Transitions Out of Ranges
Markets exit ranges for many reasons. The catalyst can be a macroeconomic announcement, an earnings release, a regulatory change, or a shift in benchmark rates. Sometimes the cause is not obvious, and the transition results from cumulative positioning and sentiment rather than a single event.
Two broad transition modes are frequently observed:
- Gradual transition. Price begins to spend more time near one boundary, producing shallow pullbacks toward the center. The range starts to tilt, and highs or lows are marginally exceeded with follow-through.
- Abrupt transition. Price jumps out of the band on a wide-range candle, often with a volume surge or a gap. The prior balance fails to attract immediate reversion.
Whether gradual or abrupt, transitions change the informational content of the chart. Boundaries that acted as containment can later act as reference zones where price reacts during retests. The shift from balance to imbalance is a structural change, not simply a larger oscillation.
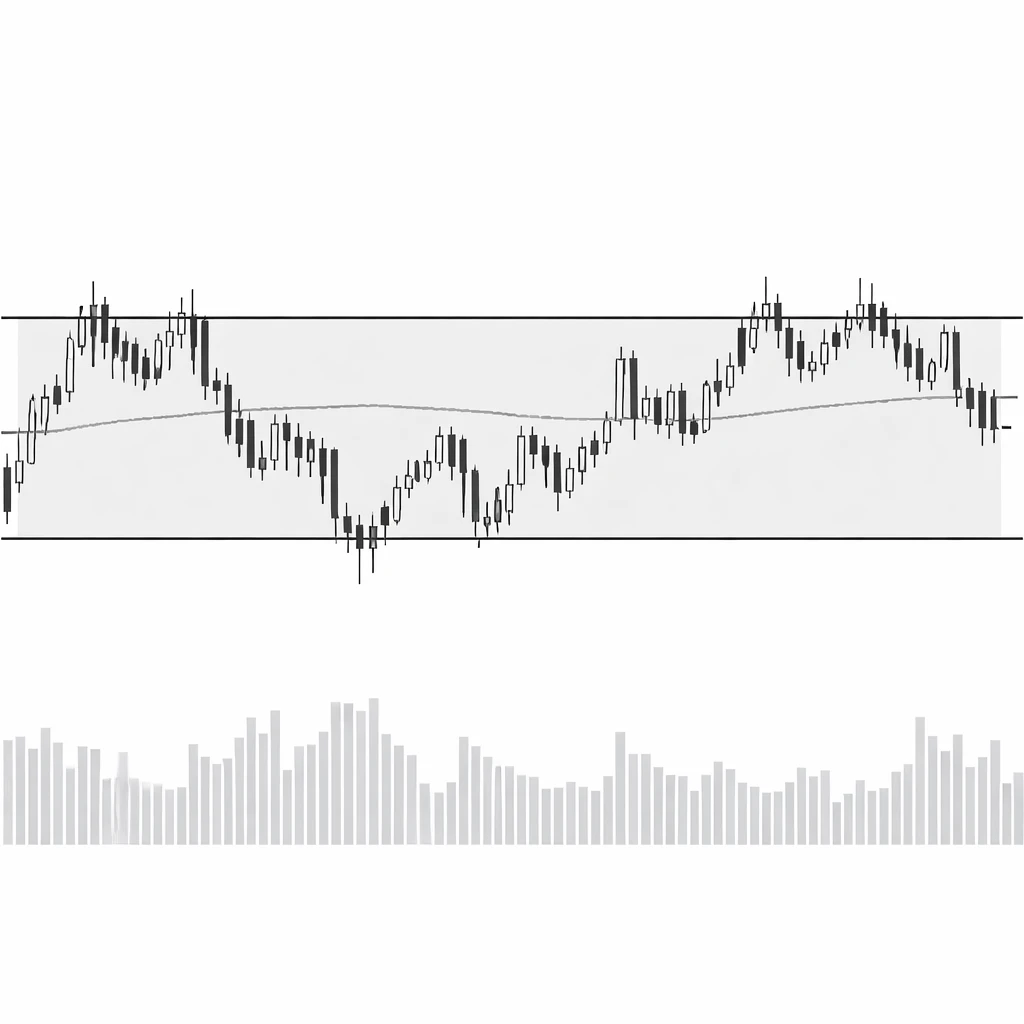
Practical Chart-Based Example
Consider a hypothetical equity that trades between 50 and 60 over a three-month period on the daily chart. The first week shows a rapid ascent from 50 to 60, followed by repeated pullbacks that fail near 55. Over the next several weeks, price establishes swing highs near 60 on three separate occasions. Each approach to 60 features diminishing candle bodies and upper wicks, indicating selling pressure. On declines, price probes 50 twice, printing lower wicks as buyers absorb supply. The midpoint, near 55, becomes a magnet where many daily closes cluster.
During this period, a 20-day simple moving average is nearly flat, crossing price frequently. A relative strength oscillator spends most of its time near the midline, rising toward higher readings when price approaches 60 and falling toward lower readings near 50. Average True Range declines from 2.5 during the initial ascent to about 1.2 during the middle of the range, then briefly increases to 1.8 during boundary tests.
Volume tells a complementary story. Activity is muted near 55, where neither side is motivated to push. At the 60 level, volume rises as sellers respond. At 50, buyers are more active. Twice, price pokes briefly above 60 intraday but closes back inside the band. Those brief excursions do not develop persistence. Near the end of the third month, an earnings release arrives. The next session opens with a gap that carries price above 60 and holds there for the close. The range ceases to govern the immediate behavior, and the chart enters a different regime.
This example illustrates several practical points. A range is not a perfect rectangle, and false breaks occur. Indicators reflect the lack of directional impulse by flattening or oscillating around neutral values. Volume often concentrates near edges and fades near the center. A catalyst can produce a decisive transition that invalidates the prior balance area.
Interpreting Risk and Uncertainty in Ranges
Ranges can feel stable, but they involve their own forms of uncertainty. The risk in a range is not simply that price moves in the opposite direction. It is also that the structure changes abruptly or that boundary definitions prove imprecise. Many tests of the edges are messy. Price can pierce a level, reverse, and then retest it in quick succession. Inside the band, short swings can be uneven, creating sequences of choppy candles and gaps.
False breaks are especially informative. A push beyond resistance that quickly retraces may signal that resting liquidity absorbed the move and that follow-through interest was insufficient. The opposite can occur at support. Interpreting such events requires attention to context, including recent volatility, the presence of scheduled news, and the behavior of related markets or indices.
Another source of uncertainty is timeframe interaction. A daily range might be a pullback within a weekly trend. A one-hour chart can cycle many times inside a daily balance. Without clarity about the timeframe of interest, conclusions about stability or imbalance can be inconsistent.
Documentation and Analytical Discipline
Clear labeling and consistent notes help avoid hindsight bias when dealing with ranges. Marking boundary zones as areas rather than single lines reduces the tendency to over-interpret small overshoots. Noting the start date, approximate width, and typical intrarange swings provides a structured record.
Analysts often document:
- The initial event that created the band, such as a sharp rejection or a volatility spike that later calmed.
- The number and quality of boundary tests, including whether tests were clean rejections or messy excursions.
- Changes in realized volatility, as reflected by ATR or candle range distributions.
- Shifts in participation, such as rising volume near one edge or sustained quiet conditions.
- External catalysts on the calendar that might change the balance, even if no specific directional outcome is expected.
This discipline does not predict outcomes. It creates a consistent framework for interpretation and helps separate normal range oscillations from structural changes.
Limitations of Range Identification
Range identification is probabilistic. Boundaries are drawn by humans using imperfect information, and the market does not honor them as rules. Several limitations are worth acknowledging.
First, ranges can be contaminated by trends at adjacent timeframes. A small upward drift can masquerade as a flat range if the analyst compresses the chart. Second, volatility regimes can shift without a clear break. A contracting range may not resolve cleanly into trend. It can instead morph into a new range at a different level. Third, statistical tools applied to ranges can give a false sense of precision. Confidence intervals, measured widths, and counts of touches describe the past. They do not convert a balance area into a predictive device.
Finally, cognitive biases affect how ranges are perceived. After a market has oscillated for weeks, it is tempting to assume it will continue. Anchoring to the band can obscure evidence that conditions are changing. Confirmation bias can lead analysts to dismiss valid breaks because they appear inconvenient. Awareness of these limits encourages humility in interpretation.
Ranging Markets Across Asset Classes
While the basic concept is common across markets, details differ by asset class. In equities, ranges can arise after earnings seasons, during periods of sector rotation, or when macro data is neutral relative to expectations. Large capitalization stocks may display tighter, longer ranges due to deep liquidity. Smaller capitalization names can show irregular ranges because of thinner order books and episodic news flow.
In currencies, ranges often align with monetary policy stasis or periods when interest rate differentials are stable. Central bank communication can keep exchange rates oscillating within defined bands until policy or macro surprises occur. In fixed income, yield ranges can reflect central bank corridor policies, market-based expectations of inflation, or changes in duration demand. In digital assets, ranges may reflect mining economics, funding rates, or liquidity cycles on exchanges.
Despite these differences, the hallmark remains the same. Ranges represent a balance between supply and demand where price revisits the same boundaries until a change in information or participation shifts the structure.
Session-Based and Event-Driven Ranges
Beyond multi-week consolidations, ranges occur on shorter horizons. Intraday, many markets form an initial balance in the early part of the session where the day’s high and low are set temporarily. Subsequent price action tests this balance as liquidity improves. Before major events, such as policy announcements or scheduled data releases, prices often settle into narrow ranges as participants reduce risk and await outcomes.
Event-driven ranges display a distinctive signature. Candles compress, gaps become less frequent, and traded volume may decline. The order book can thicken near the last traded price, but it can also be fragile if standing orders are pulled just before the event. After the event, the range can dissolve quickly as uncertainty resolves.
Measuring and Describing Ranges
Descriptive measures help analysts communicate what they observe without attaching predictive weight. Several metrics are commonly used:
- Range width. The absolute distance between the upper and lower boundaries, often measured in price units or percentage terms relative to the midpoint.
- Duration. The time spent within the band, which can be counted in bars or calendar time. Longer durations suggest a more established balance, though not a stronger barrier.
- Boundary quality. The number of distinct, well-formed tests at the edges. Clean rejections with limited overshoot indicate crisp boundaries. Messy, overlapping action suggests fuzzy edges.
- Intrarange structure. The typical size of swings inside the band and any persistent subranges. For example, a 10-point daily range might contain several recurring 2 to 3 point intraday oscillations.
- Volatility profile. Changes in realized volatility during the range, including clustering near edges or midpoints.
These descriptors provide a shared vocabulary for analysis and assist in comparing ranges across assets and timeframes.
Applying Range Context Without Prescribing Actions
Interpreting a range does not require suggesting any trade. It can be sufficient to label the regime, note the boundaries and duration, and record how indicators and volume behave. This information supports clearer communication in research notes, portfolio reviews, and risk meetings. It also sets expectations about the kinds of price behavior that are normal in balance areas, such as choppy rotations, frequent tests of edges, and occasional false breaks.
When conditions change, the analytical record of the prior range provides a benchmark. If price exits the band and holds, the previous boundaries can function as historical reference points during later pullbacks or rallies. If price re-enters the band after a failed move, the prior descriptors help frame whether the structure has meaningfully changed or remains intact.
Practical Considerations for Chart Annotation
Annotating charts can improve clarity. Analysts often draw horizontal boxes that span the period of balance, using zones rather than single lines to represent support and resistance. The box captures the area where rotational behavior occurred. Color shading can distinguish the balance area from trending segments without implying any directional conclusion.
Notes near boundary tests that record date, time, and any contemporaneous event help connect price behavior to information flow. If the market displays a series of progressively weaker or stronger reactions at an edge, annotation makes that progression more transparent to later readers of the chart.
Summary Perspective
Ranging markets are a core regime in technical analysis. They represent periods of balance where price oscillates between boundaries, reflecting a temporary agreement about value. Charts display these periods through horizontal or gently sloped support and resistance, flattened moving averages, oscillatory indicators, and characteristic volume patterns. The internal structure of ranges varies. Some are clean, others expand or contract, and many include false breaks.
Understanding ranges enhances interpretation without prescribing actions. It provides context for volatility, for how indicators behave, and for how transitions occur when new information arrives. Documenting the boundaries, duration, and internal features of a range creates a shared vocabulary that can be applied across assets and timeframes. This context supports disciplined analysis by distinguishing normal rotational behavior from structural change.
Key Takeaways
- Ranging markets are balance areas where price oscillates between identifiable boundaries instead of forming higher highs or lower lows.
- On charts, ranges appear as horizontal or gently sloped corridors with flattened moving averages, oscillatory indicators, and characteristic boundary tests.
- Ranges matter because they contextualize volatility, reveal negotiation about value, and often precede structural transitions when new information arrives.
- Variations include expanding, contracting, drifting, and stepwise ranges, and many ranges feature brief false breaks around the edges.
- Clear documentation of boundary zones, duration, volatility profile, and volume behavior improves interpretation without implying predictions or recommendations.