Why Distinguishing Pullbacks from Reversals Matters
Price does not move in a straight line. Even strong trends spend time moving counter to their primary direction. The analytical challenge is to decide whether a counter-move is a temporary pause inside the prevailing trend or an early step in a new, opposing trend. Technical analysts describe the former as a pullback and the latter as a reversal. Both are common, both can be sharp, and both can be deceptive in real time. The difference rests on market structure, not on the intensity of a single bar or the size of a gap.
The distinction is important because it frames how price action is interpreted. A pullback is part of continuation logic. A reversal is a regime change that reshapes expectations about swings, momentum, and risk. Understanding the structural signatures of each concept allows an analyst to read charts with greater nuance and to place short-term fluctuations in the correct trend context.
Clear Definitions
What is a Pullback
A pullback is a countertrend movement that unfolds within the boundaries of an established trend and does not violate the key structural levels that define that trend. In an uptrend, price makes a series of higher highs and higher lows. A pullback in this setting is a decline that produces a temporary lower high or lower low on a very small scale, but it does not break the most recent significant swing low that anchors the uptrend. It often corrects a portion of the prior advance, relieves overbought conditions, and then concludes with the trend resuming its prior direction.
Pullbacks vary in depth, speed, and duration. Some are brief and shallow, often called minor dips. Others retrace a larger share of the prior leg and take longer to resolve. The common element is structural containment. The trend remains intact because the sequence of higher highs and higher lows is not disrupted at the swing level that defines the trend.
What is a Reversal
A reversal is a transition from one dominant trend to another. In structural terms, a reversal requires a change in the sequence of swing highs and swing lows. For an uptrend to reverse, price must break below a key swing low that previously acted as a structural reference, then fail to reclaim it, and eventually produce a lower high followed by a lower low. The core idea is a change in the order of swings that define trend identity. This change can be abrupt or gradual, but it is visible in the pattern of pivots.
Reversals can begin with a pullback. The pullback ceases to be a pullback once it breaks important structural levels and the subsequent rally fails to reestablish the old pattern. The visual tell is a sequence that no longer fits the previous trend logic, often described as a break of structure, followed by acceptance of the new direction.
Market Structure: The Logic Behind Trends
Market structure is the foundation that separates pullbacks from reversals. Analysts often start by identifying the dominant swing pattern:
- Uptrend: higher highs and higher lows, with demand absorbing supply at progressively higher levels.
- Downtrend: lower highs and lower lows, with supply overcoming demand at progressively lower levels.
Swing highs and swing lows are the pivot points that outline this pattern. They emerge when price advances and then pulls back, or declines and then bounces, creating identifiable turning points. The significance of a swing depends on context. A major swing typically forms after a multi-bar move and is often visible across several timeframes. Minor swings can form inside a single session or inside a small consolidation and have less structural weight.
In this framework, a pullback is any counter-move that fails to take out a major swing level that defines the trend. A reversal requires a decisive breach of such a level, followed by price behavior that confirms the new direction, such as failing at prior support in an uptrend or failing at prior resistance in a downtrend. The change in who controls the sequence of pivots is the core structural signal.
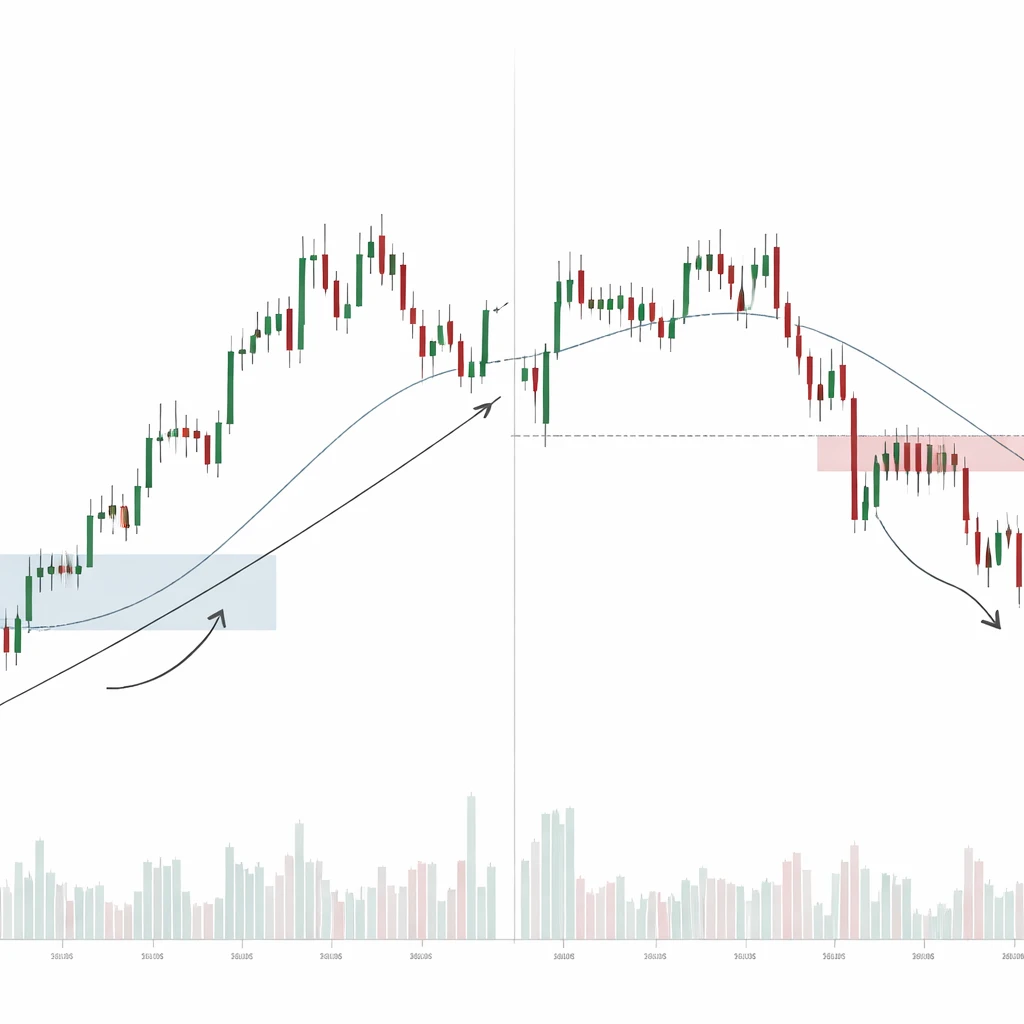
How Pullbacks and Reversals Appear on Charts
Charts present both phenomena through the interaction of bars, swings, and zones where transactions previously clustered. The following visual tendencies are frequently observed.
Depth and Proportion
Pullbacks tend to retrace a portion of the prior leg that is proportional to recent volatility. Some practitioners reference percentage retracements, such as one third to one half of the prior move, or Fibonacci proportions like 38.2 percent or 61.8 percent. These values are descriptive, not prescriptive. Their usefulness comes from placing the counter-move in relation to the energy of the trend leg that preceded it. A shallow pullback after a strong impulsive rally often indicates persistent demand. A deep retracement that remains above the prior swing low can still be a pullback if structure holds.
Duration and Rhythm
Pullbacks often consume less time than the prior impulse leg. They can also unfold in a choppier rhythm, showing alternating small bars and intrabar reversals. Reversals tend to display either a decisive structural break that occurs quickly, or a prolonged topping or bottoming process where successive attempts to continue the old trend fail and the rhythm of the swings changes. When a reversal matures slowly, the range can contract, volatility can compress, and then expand in the new direction after structure breaks.
Relationship to Moving Averages and Trendlines
Pullbacks in an uptrend often return toward upward sloping moving averages, rising channels, or trendlines drawn from prior swing lows. Contact with these references is common as trends breathe. A reversal is more likely when price slices through several reference layers, for example, breaking below a rising short-term average, then a medium-term average, and failing on the next bounce. The slope of these references matters. Flattening slopes indicate a loss of directional pressure, which increases the possibility that the counter-move is more than a routine pause.
Volume and Participation
Volume often contracts during pullbacks relative to the volume that accompanied the prior impulsive leg. Reversals often show a different participation profile. Either volume expands on the counter-move, or it expands on subsequent failures to reclaim prior support in an uptrend or to reject prior resistance in a downtrend. The idea is not that volume alone predicts outcomes, but that it helps gauge whether participation is shifting toward the opposing side as structure changes.
Momentum and Exhaustion
Oscillators and rate of change measures can help describe the intensity of each leg. Pullbacks often relieve overbought readings in an uptrend or oversold readings in a downtrend, while momentum holds above or below prior extremes. Reversals often display momentum failure near the prior high or low, followed by stronger momentum in the opposite direction once structure breaks. Divergences can occur in both settings and are most informative when aligned with structural breaks.
Why Traders Pay Attention
The distinction influences interpretation of risk, trend continuity, and the expected path of price. If a move is likely to be a pullback, many practitioners expect the prior trend to reassert itself and they focus on where structure might contain the correction. If a move is likely to be a reversal, expectations shift toward a reassessment of support and resistance, volatility, and the sequence of future swings. The difference affects how analysts read follow-through, the significance of failed breakouts, and the meaning of retests of prior levels.
In practical terms, the ability to separate minor countertrend noise from a structural change reduces the chance of misreading routine oscillations as regime shifts or dismissing early regime shifts as routine oscillations. It also helps analysts calibrate how much weight to give to recent price bars relative to longer-term structure.
Practical Chart-Based Context
Example 1: Pullback Within an Uptrend
Assume a stock advances from 50 to 80 over six weeks, producing a clear sequence of higher highs and higher lows on the daily chart. It then declines from 80 to 74 over five sessions. During the decline, volume is lower than during the prior two weeks of advance, the 50-day moving average continues to slope upward, and the pullback stalls near an area that acted as resistance during a consolidation at 73 to 75. Price prints several overlapping bars around 74 to 75, finds buyers, and begins to rebound. The prior swing low that anchored the uptrend sits at 71, which was never breached.
This behavior fits the definition of a pullback. The move corrected a portion of the prior leg, interacted with a known reference area, respected the higher low that defines the daily uptrend, and did not change the sequence of swings.
Example 2: From Pullback to Reversal
Consider a currency pair that trends higher for several weeks, then pulls back. During the decline, price breaks below the most recent daily swing low by a meaningful margin and closes there. The next rally attempt fails at the prior support zone, which now acts as resistance. A lower high forms beneath that zone, followed by a new lower low. Volume on the downside appears heavier on the futures proxy, and a momentum oscillator fails to regain its prior highs during the rally attempt.
The initial move may have looked like a normal pullback. It transitioned into a reversal when market structure changed. The break of the key swing low and the failure to reclaim it on the next advance indicate a change in control of the swing sequence.
Example 3: Intraday Context and Noise
In a futures contract that is trending down on a daily chart, intraday sessions can show sharp rallies into midday as liquidity shifts. A 15 minute chart might display several aggressive spikes higher that reverse within the session and leave lower highs intact. These spikes can invite misclassification if viewed without the daily context. On the daily timeframe, the sequence of lower highs and lower lows remains clear, and the intraday counter-moves fit as pullbacks against the larger downtrend. Only when daily structure breaks, such as a decisive close above a prior daily lower high followed by a higher low and a higher high, does the evidence shift toward a reversal.
Tools and Measures Used to Differentiate
Analysts use a toolbox of structural and descriptive measures. None is definitive on its own. Their value comes from convergence and context.
- Swing structure: identification of major and minor pivots, recognition of changes in the sequence of highs and lows, and the presence of break of structure followed by acceptance in the new direction.
- Trendlines and channels: pullbacks often respect channel boundaries or trendlines connecting prior swing points. Reversals tend to break them and then validate the break by failing on retests.
- Moving averages: the slope and relative positioning of short, medium, and long horizons provide a sense of trend health. Pullbacks tend to find reaction near rising or falling averages. Reversals tend to rearrange the stack and flatten or invert slopes.
- Retracement proportions: measuring the percentage of the prior leg retraced helps contextualize depth. Commonly watched zones exist because many participants anchor to them, not because the numbers are deterministic.
- Volume and breadth: participation on declines versus advances, and for indices, the number of constituents making new highs or lows, may corroborate the structural story.
- Momentum and volatility: changes in rate of change, volatility contraction or expansion, and failed attempts to regain prior momentum extremes can signal a shift from pullback to reversal.
In all cases, the first question remains structural. Has the sequence that defines the trend changed. If the answer is no, the move is more likely a pullback. If the answer is yes and the market accepts the new sequence by failing to reclaim broken levels, the evidence favors reversal.
Multiple Timeframe Perspective
Timeframe controls classification. A move that looks like a clean reversal on a 5 minute chart can be a routine pullback on a daily chart. Analysts often align at least two adjacent timeframes, for example daily and weekly, or hourly and daily, to understand where the observed structure sits in the larger map. A short-term reversal against the daily trend may still be a pullback on the weekly trend if weekly swing lows remain intact. Conversely, a weekly reversal can render several daily pullbacks irrelevant, since the higher timeframe has shifted the primary regime.
Timeframe alignment is especially useful when volatility changes. During high volatility periods, intraday swings can be large enough to break local structure without impacting the higher timeframe trend. During low volatility periods, small pullbacks can consume more time relative to price distance and still represent only a pause within a grind higher or lower.
Event Risk and Structural Reversals
Macro announcements, earnings releases, and policy changes can accelerate both pullbacks and reversals. Events can cause gaps, sudden momentum shifts, and temporary liquidity vacuums. What matters for classification is the structural outcome after the event. If price gaps through a key level and then establishes a new sequence of highs and lows in the opposite direction, the event may have catalyzed a reversal. If price gaps, fills the gap, and reasserts the prior sequence, the event may have produced a dramatic pullback with no regime change.
Long bases and tops also influence reversals. When price consolidates in a range for an extended period, the eventual breakout or breakdown often carries structural weight. A failed breakout that falls back into the range and then breaks the opposite side can mark a significant reversal. In contrast, a pullback that returns to the breakout level, holds, and resumes in the direction of the breakout is consistent with continuation.
Common Pitfalls and Misclassifications
Overreliance on a single indicator. A moving average cross, a divergence, or a single candlestick pattern does not define a reversal by itself. Without a structural break in swing sequence, these signals can be early or false.
Ignoring context and levels. Pullbacks commonly interact with prior support or resistance, round numbers, gaps, and anchored reference points such as the anchored volume-weighted average price. Seeing a reaction at such a level does not confirm reversal. The subsequent swing sequence is the arbiter.
Timeframe confusion. Classifying a move without awareness of the higher timeframe can produce conflicting readings. A trader focused only on a 15 minute chart may overstate the importance of local breaks that the daily chart treats as noise.
News and liquidity shocks. Thin liquidity, opening auctions, and unscheduled headlines can produce large moves that later mean-revert. Confirmation requires observing what price does after conditions normalize.
Chasing intensity instead of structure. The most dramatic bar is not always the most important. Often, the follow-through after the dramatic bar, particularly relative to prior swing points, carries the structural message.
Measurement Nuances
Several practical nuances help in differentiating pullbacks from reversals without turning the process into a set of hard rules.
Equality and symmetry of swings. In trends, pullbacks often resemble one another in depth or time. When a counter-move grows meaningfully larger than prior pullbacks in the same trend, it deserves attention. It can still be a pullback until structure breaks, but the change in character raises the probability that the trend is aging.
Acceptance around broken levels. After a level breaks, observe whether price spends time building value below former support in an uptrend or above former resistance in a downtrend. Sideways acceptance after a break often precedes further movement in the direction of the break, which is consistent with reversal dynamics.
Retests and failed retests. Many reversals include a retest of the broken level. If the retest fails and price turns away, the new structure is reinforced. In a pullback, retests of prior breakout levels often hold and lead to continuation of the original sequence.
Volatility regime. The same absolute move can carry different meaning in different regimes. A three percent pullback in a one percent daily volatility regime is large and potentially destabilizing. In a five percent regime it can be routine. Always scale distance and time by the background volatility.
Applying the Concepts Without Prescribing Strategy
The analyst’s task is to describe what the market is doing, not to predict what it must do next. With pullbacks and reversals, description centers on which side controls the sequence of pivots, how deeply and how long the counter-move runs relative to prior swings, and whether key reference levels hold or fail. The observation process benefits from clear definitions written down in advance. For example, define what qualifies as a major swing on the timeframe being analyzed, which moving averages or channels provide context, and how much variance in pullback depth is typical for the asset during the current volatility regime.
Keeping records of how past pullbacks and reversals unfolded on a given asset can improve pattern recognition. Different securities have different tendencies. Some trend smoothly with shallow and consistent pullbacks. Others trend in stair-step fashion with deep and volatile retracements. Market microstructure, liquidity, and event cadence all contribute to that signature. Recognizing the typical signature reduces the temptation to overreact to every fluctuation.
Illustrative Walkthrough: From Rally to Decision Point
Consider an index future that rallies from 4,000 to 4,600 over a month, with clear higher highs and higher lows on the daily chart. The move is supported by broad sector participation, and volume expands on up days more than on down days. The contract then pulls back to 4,480, pauses, and bounces to 4,540 before stalling. At this stage, structure is intact. The last meaningful daily swing low is 4,420, which sits below the current price. If price were to drop below 4,420 and close there, the daily uptrend would face a structural challenge. If a subsequent bounce failed beneath 4,540 and a new low printed below 4,400, the sequence would have shifted to lower highs and lower lows on the daily timeframe, indicating a reversal. If instead price held above 4,420 and reclaimed 4,600, the pullback would be classified as a routine correction inside the uptrend.
This walkthrough highlights that the classification depends on what price does around the defining swing levels. It also shows that the same initial decline can evolve into either outcome. The evidence accumulates as the sequence forms.
Limitations and Judgment
No tool cleanly separates pullbacks from reversals at the moment of inception. Classification is probabilistic and often confirmed only after the market has revealed its intent through a break and retest of structure or through a persistent change in swing behavior. False signals occur. Trendlines break without follow-through, support fails intraday and is reclaimed by the close, and momentum indicators flip in volatile noise. Patience with the structural process, combined with an understanding of the asset’s typical behavior, helps avoid premature conclusions.
Analysts also weigh the cost of misclassification. Treating a reversal as a pullback can understate risk and trend change. Treating a pullback as a reversal can overstate risk and cause frequent regime shifts in interpretation. This is another reason to anchor decisions to swing structure rather than to individual bars or single indicators.
Key Takeaways
- A pullback is a countertrend move that respects the key swing levels defining the existing trend, while a reversal changes the sequence of highs and lows that define that trend.
- Depth, duration, and rhythm provide context, but structure is the arbiter. A move remains a pullback until a meaningful swing level breaks and the market accepts the new direction.
- Visual cues include interaction with moving averages, trendlines, and prior support or resistance, along with changes in momentum, volume, and volatility.
- Timeframe matters. A reversal on a short timeframe can be a pullback on a higher timeframe, so alignment across horizons is essential for correct classification.
- No single indicator is decisive. Converging evidence from swing structure, participation, and context improves the reliability of distinguishing pullbacks from reversals.