Financial markets produce a continuous sequence of prices, but the sequence is not random noise. It organizes itself into structures that reflect the ebb and flow of participation, liquidity, and information. Technical analysis gives language to that organization. One of the core elements of that language is market structure. Within that framework, a market structure shift describes a meaningful change in how price is making and defending highs and lows. Understanding this concept improves the clarity of chart reading, supports disciplined interpretation of trend health, and helps analysts avoid forcing a narrative on the data.
Defining Market Structure
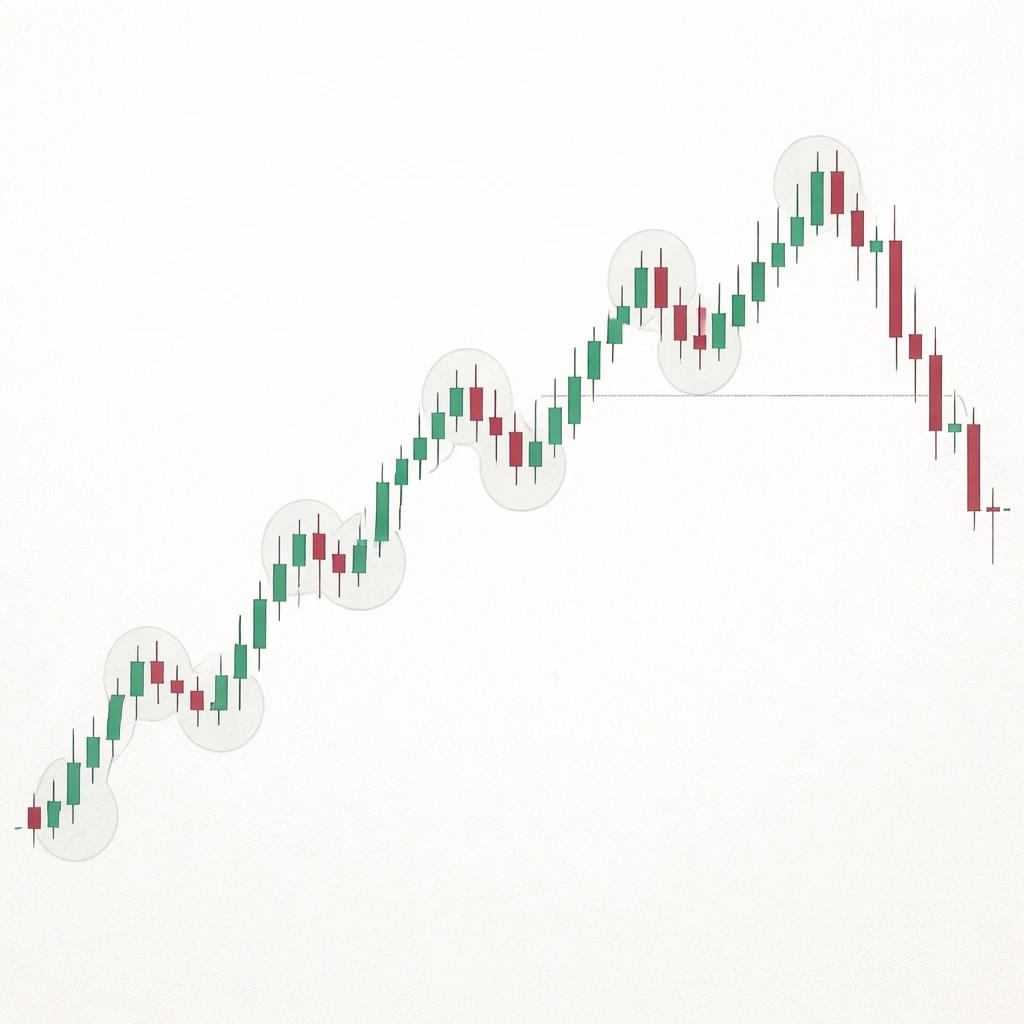
Market structure describes the arrangement of swing highs and swing lows on a chart. The concept is rooted in long-standing ideas that predate modern indicators. In a rising structure, the sequence of price pivots tends to form higher highs and higher lows. In a falling structure, the sequence tends to form lower lows and lower highs. In a range, price rotates between relatively stable swing boundaries with limited net progress.
These patterns do not imply predictability. They provide a framework for describing what has occurred. That description is valuable because it helps distinguish a healthy trend from a trend that is stalling, and a balanced market from a market that is beginning to lean. The language of structure is communal across timeframes. The same criteria that outline a trend on a weekly chart also appear in condensed form on an hourly chart.
What Is a Market Structure Shift
A market structure shift is a change in the dominant sequence of swings. The classic example is an uptrend that has been forming higher highs and higher lows. If price fails to form a new higher high and then breaks below the most recent higher low, the sequence changes. The market has shifted from bullish structure to a structure that is at least neutral and potentially bearish. The inverse is true for a downtrend that fails to make a lower low and then breaks a prior lower high.
The shift is not a forecast. It is an observation that the pattern of control has changed. When a prior swing that had been defended by buyers in an uptrend is violated, it provides evidence that buyers no longer command the same territory. Some practitioners refer to this as a break of structure or a change of character. The precise terminology varies, but the underlying idea is the same. The market moves from one structural regime to another, even if only temporarily.
Relation to Break of Structure and Change of Character
Two terms often appear alongside market structure shift. A break of structure usually refers to price taking out a key swing in the direction of the prevailing trend. A change of character often refers to price breaking a key swing against the prevailing trend. Analysts sometimes use both to describe how an early countertrend break can precede or coincide with a broader shift. The important point is not the label. The essential task is to define which swing levels matter and to observe whether they remain intact or fail.
How Market Structure Appears on Charts
Charts display a sequence of candles or bars that contain highs and lows. Structure emerges from that sequence. Analysts identify swing highs as local maxima and swing lows as local minima, then evaluate whether the sequence is progressing upward, downward, or sideways.
Identifying Swings
A common approach is to define a swing high as a high preceded and followed by lower highs, and a swing low as a low preceded and followed by higher lows. These are sometimes called pivot highs and pivot lows. More conservative definitions require additional bars on each side to reduce noise. Regardless of the specific rule, consistency is important. Without consistent swing identification, any discussion of structure becomes subjective.
Closes, Wicks, and Gaps
Whether a swing is considered broken can depend on the analyst’s rule set. Some require a full bar close beyond the level, arguing that intrabar spikes are less reliable. Others treat any breach of the wick as sufficient. Instruments that gap frequently can complicate this decision. A gap that opens beyond a swing low clearly violates that level, but the lack of trading in between can leave questions about how much liquidity traded through the level. The rule set should be chosen deliberately and then applied consistently to avoid hindsight bias.
Timeframe and Fractals
Structure is fractal. A five-minute chart can be in a downtrend while the daily chart remains in an uptrend. A market structure shift on a lower timeframe might be a minor pullback within a larger trend, or it might be the first visible evidence of a higher timeframe transition. Analysts often start with a higher timeframe to define the primary context, then examine how lower timeframes are relating to that context.
Recognizing a Shift in Practice
Consider an uptrend with a visible series of higher highs and higher lows. The most recent higher low acts as a reference point for buyers. If price fails to exceed the prior higher high, then turns down and closes below the most recent higher low, the market has shifted. The sequence of buyers defending progressively higher territory is no longer intact. The new information is the failure of buyers to hold a level that had mattered in the past.
In a downtrend, the mirror image holds. A consistent pattern of lower lows and lower highs is in place. If price fails to produce a new lower low and then closes above the most recent lower high, the downtrend’s structure has shifted. Sellers no longer defend lower highs in the way they had been doing.
Two details deserve emphasis. First, a single bar that spikes through a level and reverses may or may not be sufficient to define a shift. That decision rests on the rule set you adopt. Second, not every shift is major. Breaking an internal swing created during a small consolidation carries a different interpretive weight than breaking a prominent swing that defined the trend’s rhythm for weeks.
Practical Chart-Based Context
Market structure shifts are easiest to understand when anchored to concrete situations on a chart. The following examples describe common contexts without prescribing actions.
Example 1: From Uptrend to Neutral or Bearish Structure
Imagine a daily chart of an equity index that has moved upward for several weeks. Each push higher makes a higher high, and each pullback makes a higher low. At some point, price rallies into a prior high but stalls beneath it. The next downswing accelerates and closes below the most recent higher low. The uptrend’s structure is now compromised. Observers would note that the market has shifted from a clear pattern of higher lows to a situation where buyers failed to defend a reference point they had previously protected.
In practical terms, this shift is a change in evidence, not a forecast of what must come next. The path forward can vary. Price may continue lower and establish a new trend in the opposite direction. It may instead enter a trading range, oscillating between recently created swing boundaries. Or it may reclaim the broken level. The structural shift simply indicates that the prior pattern of control has been interrupted.
Example 2: Shift Within a Range
Consider a currency pair that has spent weeks in a horizontal range. The upper boundary rejects advances, and the lower boundary halts declines. Within the range, smaller trends appear on intraday charts. Suppose that after a test of the upper boundary, price forms a sequence of lower highs and then breaks an intraday swing low that had served as support for several sessions. At the range scale, the market is still balanced, yet at the intraday scale, the structure has shifted downward. This illustrates the importance of defining the timeframe in which a shift is observed and interpreted.
Example 3: Gaps and Event-Driven Shifts
On an earnings day, a stock gaps below a prior daily swing low and opens at a much lower price. Even if the next bars bounce, the fact that the open printed beneath the prior swing low indicates that the level was not defended during the transition. The structure has shifted at the daily scale. Event-driven shifts can be more abrupt, and they often compress what might otherwise have been a multi-day process into a single session. Analysts must decide whether to treat the gap as sufficient evidence of a break, and then maintain that rule consistently across similar cases.
Why Traders Pay Attention to Structure Shifts
Market structure shifts attract attention because they update the narrative of control. A shift indicates that the side which had been dictating the sequence of swings has lost that advantage, at least for the moment. This information matters for several reasons.
- Regime identification. A string of higher highs and higher lows describes an uptrend. When that string breaks, the regime may be transitioning to neutral or bearish conditions.
- Risk context. Structural breaks reveal where the market could not defend prior territory. That helps observers understand where sensitivity to new information has increased.
- Timing of information flow. Shifts often occur near points where liquidity changes, such as into or out of scheduled events, or as ranges compress and then expand.
- Location within larger patterns. A shift at a weekly swing level typically carries more weight than a shift at a small intraday pivot.
- Narrative discipline. By focusing on observable structure, analysts reduce the temptation to fit price into a preferred story.
Assessing the Strength of a Shift
Not all shifts are equal. Analysts often evaluate several dimensions to gauge how consequential a structural change might be.
- Magnitude. How far beyond the broken swing did price travel before pausing. Larger distance can indicate conviction, although it can also reflect temporary volatility.
- Persistence. After the initial break, does price continue to produce follow-on swings in the new direction, or does it immediately reverse and reclaim the level.
- Retest behavior. When price returns to the broken level, does it reject promptly, churn around the level, or pass through without difficulty.
- Time. How much time elapsed as the shift unfolded. Slow, grinding transitions can imply different participation than sudden breaks.
- Breadth. In indices or sectors, whether multiple components exhibit similar structural changes can provide context about whether the shift is isolated or broad.
Volume can also inform interpretation where it is a reliable measure for the instrument. A break that occurs on meaningfully higher participation may be viewed as more consequential than a break on a quiet session. This is not a rule, only a dimension that some analysts track to refine context.
Common Pitfalls and Ambiguities
Because structure is derived from swings, and swings require definitions, ambiguity is always present. Several pitfalls recur in practice.
- Changing definitions midstream. Switching between wick breaks and close-only breaks after the fact introduces bias. Choosing a rule set and applying it consistently anchors the analysis.
- Overweighting internal swings. A minor pivot formed during a brief pause inside a trend does not carry the same importance as a clear external swing that defined the trend’s staircase. Distinguishing between internal and external structure helps prevent overreactions.
- Ignoring timeframe context. A five-minute shift against a dominant daily trend can unwind in minutes. Analysts benefit from asking which timeframe their conclusion is intended to address.
- News and liquidity shocks. Breaks that occur during thin liquidity or around scheduled events can travel further than usual and then retrace. Treating those breaks identically to routine session activity can mislead.
- Confusing momentum with structure. Strong momentum can carry price to new extremes without altering the sequence of swings. Conversely, a slow deterioration can shift structure before momentum indicators respond.
Annotating Charts for Structural Clarity
Structure is easier to evaluate when it is clearly annotated. Marking swing highs and lows, labeling the current trend condition, and drawing attention to the last defended swing can reduce ambiguity. Some practitioners record charts at regular intervals with the same annotations, which helps reveal whether the market is confirming or challenging prior structure.
This process can be as simple as keeping a running count of higher highs and higher lows, or lower lows and lower highs, per timeframe. When a count is broken, the chart note documents the date, price, and bar type of the break. Later, when reviewing the sequence, the analyst can see how long the new condition persisted and whether it propagated into higher timeframes or faded.
Internal Versus External Structure
Analysts often distinguish between external structure, which refers to the large swings that define the boundaries of a trend or range, and internal structure, which refers to smaller oscillations within those boundaries. A break of internal structure may change the micro rhythm without altering the dominant regime. A break of external structure is more likely to mark a significant shift.
For example, during a strong uptrend on the daily chart, the hourly chart might carve several lower highs and lower lows during a pullback. That internal shift marks a pause in the uptrend, not necessarily a full reversal. Only when price breaks a major daily swing low would the external structure change.
Contextual Clues Around Shifts
Several contextual clues often surround structure shifts. Consolidation preceding the break can signal that the market is storing energy and refining levels of interest. Repeated failures to extend in the dominant direction can foreshadow vulnerability of the last defended swing. Conversely, a very extended move into a known area of supply or demand can produce a fast break that quickly mean reverts. None of these clues guarantees an outcome. They enrich the descriptive narrative.
Order flow characteristics, where observable, can also complement structural analysis. For example, a break that occurs with obvious aggression at the bid in futures, or with a rush of market orders in an equity, may provide additional evidence that the defense of the level failed decisively. The reliability of such observations depends on the instrument and the data quality available.
Multi-Timeframe Alignment
Many analysts evaluate structure across several timeframes to understand alignment. When the weekly, daily, and intraday charts all show the same directional structure, conditions are described as aligned. When the lower timeframe has shifted but the higher timeframe has not, the condition is mixed. Mixed conditions are common, especially during transitions. Recognizing the distinction helps prevent conflating a short-lived micro shift with a durable regime change, or ignoring an early sign that a larger trend is weakening.
From Shift to Scenario Building
Market structure shifts serve as inputs to scenario building. An observed break suggests new paths that the market might explore. One scenario is continuation in the new structural direction, another is reversion, and a third is consolidation. Each scenario can be monitored with objective reference points taken from the same structural features that prompted the shift. This approach maintains coherence between observation and interpretation.
Illustrative Walkthrough
Consider the following step-by-step description of how an analyst might document a shift without implying any trade decision.
- Define the timeframe of interest, for instance daily candles.
- Mark the most recent external swing high and swing low that have anchored the trend or range.
- Identify the last defended swing. In an uptrend, this is the most recent higher low that supported the advance.
- Observe subsequent bars. If price fails to exceed the prior higher high and then closes below the last defended higher low, record a structural shift.
- Note the character of the break, such as distance beyond the level, speed, and whether a retest occurs.
- Reassess the label for the market, moving from uptrend to neutral or downtrend as warranted by the swing sequence.
By writing the observations at the time they occur, the analyst reduces hindsight distortion and builds a catalog of examples. Over time, that catalog improves recognition of which shifts tended to persist and which quickly failed in the specific instruments and conditions studied.
Special Cases
Certain market conditions require additional care when interpreting shifts.
- High volatility sessions. Rapid reversals can break and reclaim levels within minutes. In such conditions, strict rules about closes versus wicks and the number of confirming bars can reduce noise.
- Illiquid instruments. Sparse trading can produce erratic spikes that mimic breaks. Analysts often validate breaks by looking for supporting evidence, such as sustained trading beyond the level rather than a single print.
- Structural gaps. When gaps skip over multiple minor swings, the chart may show a single large candle body with no trading in between. Designating which swing was broken should follow the predefined hierarchy of swing importance.
What Market Structure Shifts Do Not Tell You
Market structure shifts are descriptive, not prescriptive. They do not dictate what should be done or predict how far a move will travel. They do not replace risk management. They are not a shortcut that eliminates uncertainty. Their value lies in creating a common vocabulary for interpreting what price has already shown and in organizing future observations coherently.
Integrating Structure With Other Forms of Analysis
Many analysts integrate structural reading with other evidence, such as momentum measures, volatility regimes, and fundamental catalysts. For example, a structural shift that aligns with a change in realized volatility may be read differently than a structural shift that occurs in a compressed volatility environment. Likewise, structural shifts that cluster across related assets can indicate broad-based changes in conditions. Integration should preserve the clarity of the structural narrative rather than overwhelm it with unrelated signals.
Concluding Perspective
Market structure shifts provide a disciplined way to translate the flow of price into an intelligible record. They distill weeks of movement into a few factual statements about which swings held and which failed. Those statements help analysts manage cognitive load, distinguish between noise and signal, and maintain a consistent map of the market’s evolving form. The discipline is in the definitions and the consistency with which they are applied across time and across instruments.
Key Takeaways
- A market structure shift occurs when the sequence of swings that defined the current regime is violated, such as a break of the last defended higher low in an uptrend.
- Clear swing definitions, including rules for closes versus wicks and the distinction between internal and external swings, are essential for consistent interpretation.
- Timeframe context matters. A shift on a lower timeframe can be a minor pause within a higher timeframe trend or the first sign of a larger transition.
- The strength of a shift can be evaluated by magnitude, persistence, retest behavior, time, and breadth, while recognizing that none of these dimensions guarantees outcomes.
- Structure is descriptive, not predictive. It organizes observations into a coherent narrative without implying strategies, entries, exits, or recommendations.