Introduction
Breakouts and breakdowns sit at the intersection of trend analysis and market structure. They describe price moving out of a well-defined area where supply and demand had been largely balanced. When price escapes that area to the upside, the move is called a breakout. When it escapes to the downside, it is called a breakdown. These events are often interpreted as informational updates about the balance of buying and selling pressure, with potential implications for trend continuation, reversal, or regime change.
The idea is straightforward, but its interpretation depends on context. The same upthrust beyond a ceiling can carry very different meaning depending on whether it follows an extended base, a congested range after a rally, or a retest of a prior high in an otherwise weak market. Understanding the structure around the level, how the move appears on the chart, and how participation changes at the moment of escape helps analysts judge what the move may be saying about the underlying auction.
Definitions and Core Concepts
Breakout. A price move that pushes through and persists beyond a defined resistance area. Resistance can be a horizontal band built by repeated highs, a sloping trendline, or the upper boundary of a pattern such as a triangle or channel. The defining feature is that price had previously struggled to trade and hold above that area, and then does so.
Breakdown. A price move that pushes through and persists below a defined support area. Support can be a horizontal band defined by repeated lows, a sloping trendline, or the lower boundary of a pattern. The defining feature is that price had previously found buying interest near that level, and then fails to attract such support.
Persistence. Analysts often differentiate between a brief probe and a move that holds. A common convention is to look for evidence such as a close beyond the level, a price expansion that carries several increments beyond the boundary, or a retest that fails to return inside the prior area. The precise threshold varies by methodology and timeframe, but the logic is consistent: lasting progress beyond the prior barrier indicates a potential change in participation.
Market structure. The arrangement of swing highs and lows, ranges, trendlines, and consolidation areas that provides the backdrop for any breakout or breakdown. Structure gives the level its meaning. A horizontal boundary formed by 20 sessions of balance contains more information than a fleeting, single-touch line.
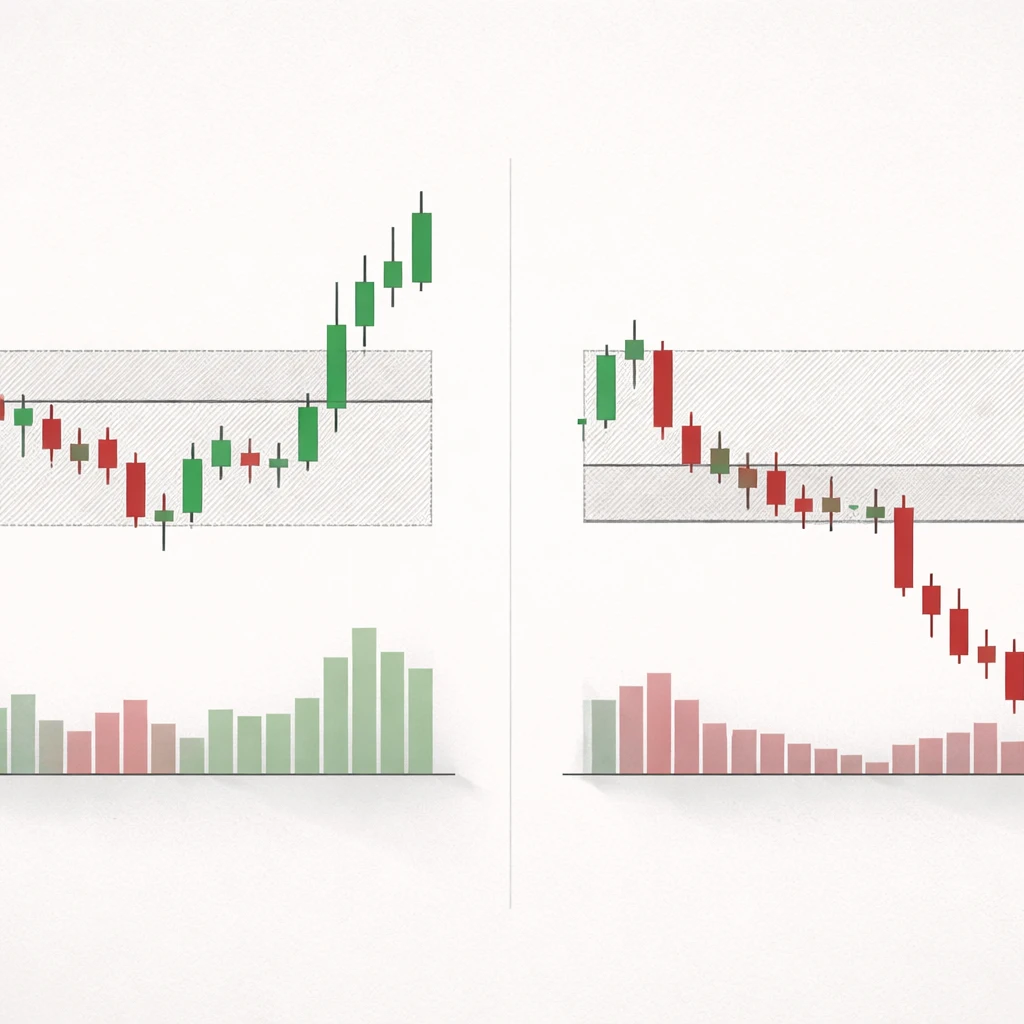
How Breakouts and Breakdowns Appear on Charts
On a candlestick or bar chart, the concept is visual. Price approaches a boundary that has been tested multiple times, pauses or compresses, then moves beyond it. The appearance can vary, but several recurring elements help recognition.
Horizontal ranges. Many breakouts and breakdowns emerge from rectangles formed by repeated highs and lows. The more numerous and recent the touches, the clearer the boundary. An upside breakout from such a range prints new highs relative to the range and may show a sequence of wide-bodied candles. A downside breakdown does the opposite, printing new range lows and often increasing range per bar.
Trendlines and channels. In trending markets, price may press against a sloped boundary. A breakout through the top of a downward channel, for instance, signals that sellers no longer control the same trajectory. A breakdown through the lower boundary of an upward channel can indicate weakening demand.
Consolidations and volatility contraction. Before many escapes, price often compresses into narrower ranges. This contraction can be visible as smaller candles, tight intraday ranges, or a triangle-like pattern. The subsequent breakout or breakdown often coincides with a volatility expansion, visible in longer candles or wider ranges.
Gaps. Breaks can occur with price gaps, especially around earnings or macro announcements. An upside gap over resistance or a downside gap under support is a form of breakout or breakdown. Analysts typically examine whether the gap holds and whether trading occurs at new prices rather than immediately refilling the gap.
Volume and participation. While price defines the break, volume often reflects the degree of participation. In many cases, a sustained breakout or breakdown will be accompanied by volume that is elevated relative to recent activity. The change need not be extreme, but a noticeable expansion suggests broader acceptance of the new price area.
Why Analysts Pay Attention
Breakouts and breakdowns provide information about the ongoing auction process.
Shift in balance. Price is the mechanism by which the market discovers where supply and demand meet. When price escapes a level that previously contained it, the market is communicating that the available liquidity at that boundary was insufficient to maintain balance.
Regime signals. A clean escape can mark a transition from a range to a trend, from compression to expansion, or from one directional bias to another. Analysts tracking market regimes often use breakouts and breakdowns as one ingredient in classifying the current state.
Structure and risk context. Even without prescribing any action, a break supplies structural reference points. The prior ceiling or floor becomes a feature on the chart that can inform discussions of where price has migrated and where it might encounter supply or demand again.
Event interpretation. Breaks that occur around earnings, policy decisions, or macro releases help observers judge how new information is being discounted. A decisive breakout on elevated participation after a major announcement suggests that the news altered expectations sufficiently to reprice the asset beyond prior boundaries.
Market Structure: Support, Resistance, and Liquidity
Support and resistance are not single price ticks. They are zones that reflect areas where many market participants acted previously. The clarity of a breakout or breakdown is tied to how well defined these zones are.
Repeated interactions with a level create memory. If a stock stalls near 50 on four separate occasions over several weeks, participants notice. Orders accumulate around such levels for a variety of reasons, including risk controls, profit taking, or systematic processes that reference prior highs and lows. As orders cluster, liquidity tends to increase near the boundary. A breakout often occurs when incoming demand is strong enough to absorb that liquidity and trade through the pocket of orders above the level. A breakdown occurs when sellers overcome the bids that had been supporting price.
This process is amplified by stop orders. Resting stops that sit just beyond prior boundaries can provide additional fuel once triggered. The existence of stops does not change the definition of a breakout or breakdown, but it helps explain why some moves accelerate quickly once the boundary is breached.
Context Matters: Continuation, Reversal, and Base Structure
Not all breaks carry the same informational weight. Context influences interpretation.
Continuation out of a base. When price advances into a multi-week consolidation, trades sideways, and then pushes out through the top, analysts often regard the break as consistent with the prevailing directional bias. The length of the base, the number of touches, and the tightness of the final consolidation influence the perceived significance.
Reversal through a prior pivot. If price has been trending down and then pushes above a well-defined lower-high pivot, the move can imply a shift in control. Conversely, a decline through a higher-low pivot in an uptrend can foreshadow a change in character. These are still breakouts and breakdowns, but their meaning ties to the sequence of swings rather than a prolonged rectangle.
Overhead and underfoot supply. The path beyond a boundary matters. If the breakout runs into dense prior trading immediately above, the move may face more friction. If the area beyond the level is relatively thin, price may traverse it quickly. Similar considerations apply to breakdowns encountering historical congestion.
How to Recognize Quality in a Break
Analysts often evaluate the quality of a breakout or breakdown by examining several observable features. These features do not prescribe actions. They help classify the move.
- Clarity of the boundary. Multiple, recent, and well-spaced touches that define a level provide a stronger reference than a single isolated pivot.
- Magnitude relative to recent volatility. A break that extends beyond the boundary by an amount that is meaningful relative to the asset’s typical daily range suggests genuine expansion.
- Persistence and follow-through. Holding beyond the level for more than a brief probe indicates acceptance of new prices. Some observers prefer to see a close beyond the level on the timeframe they are analyzing.
- Participation. Volume or breadth that expands during the break can confirm wider interest. In indices, participation might mean more constituents making similar moves.
- Alignment across timeframes. A break on the daily chart that aligns with a supportive weekly context tends to carry more interpretive weight than one that contradicts the higher timeframe.
Practical Chart-Based Examples
Consider an equity that traded between 48 and 52 for 20 sessions. The range is clear, with price repeatedly retreating from 52 and finding buyers near 48. On day 21, the stock opens at 51.80, trades to 52.20, briefly dips to 51.60, then rallies to close at 52.70. The candle is larger than average, and volume is about 1.6 times the 20-day average. On this chart, an upside breakout has occurred. The structure had been horizontal, the boundary was well defined, and price not only traded above 52 but also closed above it with increased participation. Observers would note that the market accepted higher prices relative to the prior balance area.
Now consider a futures contract that had been supported near 3,900 for two weeks, with repeated lows clustering between 3,905 and 3,895. A morning selloff on a macro data release pushes the contract to 3,888 within the opening half hour. The first push under 3,895 is fast, volume jumps, and the next bars do not reclaim the prior support zone. Instead, the session trends lower with expanding intraday range. This is a breakdown on the intraday timeframe, visible as a clean escape below a level that had been defended repeatedly.
Finally, imagine a currency pair that has pressed against a descending trendline several times. After a prolonged decline, price retests the line and then closes above it for the first time in months. The move by itself is a breakout through a dynamic resistance line. Its interpretation would be grounded in the broader context of the downtrend, nearby horizontal levels, and whether the move sees follow-through in subsequent sessions.
False Breaks, Traps, and Rejections
False breakouts and breakdowns are common. Price may push through a level, attract a burst of activity, then return to the prior range and continue trading inside it. Several mechanisms can produce such rejections.
Insufficient participation. If the move beyond the boundary is not accompanied by broader interest, early participants may have difficulty sustaining progress. The chart often shows a long wick beyond the level and a close back inside the range.
Competing structure nearby. An overhead consolidation or prior high immediately above a breakout can create friction. Similarly, a cluster of prior lows immediately below a breakdown can absorb the move. When multiple structures are stacked close together, breaks are more prone to failure.
Broader market headwinds. In equities, an individual stock breakout that goes against a weak sector or risk-off index environment can falter even if the stock’s own pattern is clean. In cross-asset terms, a commodity breakdown in the face of supportive macro flows may see limited follow-through.
Liquidity grabs. Markets sometimes push beyond a level to trigger stops and uncover liquidity before reverting. The chart footprint can look like a quick spike and reversal. Recognizing this behavior requires experience with the instrument’s microstructure and typical volatility.
A failed breakout or breakdown does not invalidate the concept. It simply reports that, at that moment, the market was not ready to accept prices beyond the boundary. Observers typically record such events as evidence about who currently holds initiative and whether the balance of pressure is strengthening or weakening.
Measuring the Break Relative to Volatility
Because price action is scale dependent, magnitude must be viewed in context. A 1 percent move may be decisive in a low-volatility index yet trivial in a high-beta stock. One common approach is to compare the distance traveled beyond the level to a recent measure of typical range, such as an average of true ranges. If the break exceeds a meaningful fraction of the recent daily range, the move better qualifies as an expansion rather than random noise.
Time also matters. A breakout that survives multiple sessions is qualitatively different from an intraday push that fades by the close. Many analysts look for a combination of price distance and time spent beyond the level to classify a break as durable.
Timeframes and Multi-Horizon Interpretation
Breakouts and breakdowns occur on every timeframe. An intraday chart may show a clean escape from a morning range, while the daily chart shows the move as a small candle inside a larger consolidation. This nested structure is a source of both opportunity and confusion.
Analysts often assign more weight to higher timeframes when interpreting the meaning of a break. A weekly close through a multi-month high typically carries more significance than a 5-minute push through an intraday ceiling. That said, short-horizon breaks can be the early stages of higher timeframe transitions. Linking timeframes requires careful attention to which structure the current move is interacting with.
Role of Confirmation and Retests
Some observers prefer to see a retest of the broken level as a sign of acceptance. After an upside breakout, price may pull back toward the prior resistance area. If buyers step in near that zone and price holds above it, the level has functioned as support. The same logic applies in reverse after a breakdown. Whether a retest occurs depends on liquidity, urgency, and the presence of catalysts. A lack of retest is not inherently negative. Markets with strong imbalance may not look back for some time.
Events and Catalysts
Breakouts and breakdowns often cluster around information events. Earnings, guidance changes, regulatory actions, rate decisions, and major data releases can all provide new information that requires a revaluation of the asset. When new information arrives, prior balance areas can be repriced quickly, sometimes by way of gaps. In these cases, the chart conveys both the location of the boundary and the market’s judgment about the new information through the size and durability of the gap.
Analysts parsing event-driven breaks focus on whether the market continues to transact at the new prices, how the move spreads across related instruments, and whether liquidity conditions normalize or remain strained. These observations inform conclusions about whether the move is idiosyncratic or part of a broader repricing.
Breadth, Correlation, and Cross-Checks
In broad markets, participation across constituents adds context. An index breakout that coincides with a large percentage of constituents making new highs communicates something different from a break led by a narrow group. Sector leadership patterns, correlation shifts, and cross-asset confirmation can all inform how observers interpret the durability of a move.
Cross-checks also matter at the instrument level. For example, a breakout in a commodity-sensitive equity may be more credible if the underlying commodity also shows constructive structure. Conversely, a breakdown in a rate-sensitive sector may have different implications if yields are stable rather than moving sharply.
Chart Features That Refine Interpretation
Several chart features frequently accompany notable breaks. None of these are deterministic. They serve as descriptive cues that analysts watch to refine interpretation.
Range compression before expansion. A sequence of narrowing ranges, often visible as smaller candles or a triangle, can precede powerful breaks. The transition from compression to expansion is the core of many structural analyses.
Change in candle character. Moves that feature wide real bodies closing near their extremes suggest urgency. Wicks that reject new prices, especially when coupled with low participation, can hint at fragility.
Gaps that hold. When gaps beyond a boundary do not fill quickly, it indicates acceptance of new prices. Conversely, fast gap fills can indicate the market was not ready to transact at the new level.
Volume clusters. Areas where high volume traded previously can act as magnets or barriers. A breakout into a low-volume area can traverse quickly. A breakdown into a high-volume area may slow and churn as it encounters stored liquidity.
Limitations and Common Pitfalls
Breakouts and breakdowns are not rare, and not all are informative. Several pitfalls recur in practice.
Chop in range-bound markets. In periods of low directional conviction, markets may oscillate around boundaries and produce repeated false breaks. The chart can show a series of minor breaches without lasting progress. Recognizing a choppy regime helps set expectations for lower signal quality.
Overfitting to lines. Drawing levels is part art and part science. Different analysts can draw slightly different boundaries from the same data. Overprecision can mislead. Support and resistance are zones, not single ticks.
Ignoring higher timeframe context. A compelling 1-hour breakout that runs directly into weekly resistance has a tougher path than one breaking into open space. Without integrating the broader map, analysts can overstate the meaning of a lower timeframe move.
Confusing cause and effect. Volume may increase because price is moving, not necessarily because new information has arrived. Correlation across instruments may reflect mechanical flows rather than fundamental linkage. Treat correlation and volume as descriptive, not explanatory, without further evidence.
Documentation and Communication
In professional settings, analysts often document breakouts and breakdowns to create an audit trail of structural changes. A clear record typically includes the level or zone, timeframe, the nature of the structure that preceded the break, the character of the move through the level, and any relevant participation metrics. This discipline helps maintain objectivity and supports later evaluation of which types of breaks tended to convey useful information in a given market.
Extended Example: From Base to Breakout and After
Consider a technology stock that advanced from 35 to 60 over three months, then formed a horizontal base between 57 and 60 for another six weeks. The base shows multiple upper wicks near 60 and three clear lows near 57. Ranges within the base progressively tighten, with the last ten sessions trading between 58.20 and 59.80. On the sixth week’s final session, the stock opens at 59.70, dips to 59.50, then rallies steadily to close at 60.40. The candle has a wide real body, and volume registers 1.8 times the 30-day average. The weekly chart closes above the prior weekly closing high as well.
What can be inferred from the chart alone? The multiweek base defined a clear upper boundary. The breakout session featured both price expansion and elevated participation. The higher timeframe signal aligned with the daily picture. Analysts would note these elements as evidence that the market accepted new highs after a period of balance.
In the following week, price revisits the 60 area intraday on two occasions but finds buyers each time, leaving lower wicks near 60. These retests function as a check on whether the prior ceiling now behaves as support. Price then advances to 62 over subsequent sessions. None of this certifies a particular outcome for the next month, but the sequence illustrates how structure, break, participation, and acceptance interact.
Extended Example: Breakdown From a Rising Channel
Imagine an industrial stock climbing within an upward sloping channel for two months, with higher highs and higher lows respecting the channel boundaries. Over several sessions, momentum slows and candles become smaller. A negative premarket announcement causes a gap down that opens beneath the lower channel boundary. Early trading attempts to recover into the channel fail, and the stock closes below the boundary with above-average volume. On the weekly chart, the move also undercuts a prior higher low from five weeks earlier.
From a structural standpoint, several features align. The dynamic support defined by the channel has been breached, there is a gap that did not immediately fill, and the higher timeframe swing structure has weakened by violating a prior higher low. Analysts would record this as a breakdown that changed the character of the trend. The next questions would concern nearby historical support zones and whether subsequent trading accepts prices below the channel.
Integrating Breadth and Intermarket Clues
Suppose a broad equity index breaks out to a new 6-month high. On the same day, the percentage of index constituents making new 20-day highs rises materially, and sector leadership is diversified rather than concentrated in one industry. Credit spreads are stable, and cyclical commodities are firm. These cross-checks suggest the breakout is embedded in a supportive macro and micro backdrop. Alternatively, if the index breakout occurs with narrow leadership and deteriorating breadth, the information content may be less robust. The chart of the index alone would not reveal this nuance, which is why many observers supplement price with breadth and intermarket context.
Closing Thoughts
Breakouts and breakdowns are simple to define and nuanced to interpret. They formalize a recurring observation about markets: price alternates between balance and imbalance. By identifying where balance last held, then observing how price behaves when that boundary is tested and exceeded, analysts can extract information about changing participation and potential regime shifts. Careful attention to structure, timeframe alignment, participation, and the surrounding market context strengthens interpretation without relying on prescriptive rules.
Key Takeaways
- Breakouts and breakdowns mark price moving beyond well-defined resistance or support, signaling a change in the supply-demand balance.
- Quality is influenced by boundary clarity, magnitude relative to recent volatility, persistence beyond the level, and participation.
- Context matters: the same break can imply continuation from a base or a character change when it violates a prior swing.
- False breaks are common. Rejections often reflect insufficient participation, nearby structure, or broader market headwinds.
- Interpreting breaks benefits from multi-timeframe analysis, event awareness, and cross-checks such as breadth and related markets.