Support is one of the most widely referenced concepts in technical analysis. At its core, support refers to a price level or zone where a decline in an asset’s price tends to slow, pause, or reverse because demand becomes active enough to absorb supply. The focus is not on prediction but on interpretation. When price approaches a historically important level and selling pressure meets stronger buying, market participants often describe the area as support.
Understanding support helps frame how prices behave under pressure. It provides a reference for observing whether the market accepts lower prices or rejects them. This perspective is useful across markets and timeframes because it is grounded in basic auction dynamics and investor behavior.
Defining Support
Support is best described as a zone rather than a single, exact price. Markets rarely turn at a perfectly precise tick. Instead, there is usually a band of prices where buying interest concentrates. Within that band, orders accumulate, selling slows, and the market can show signs of absorption. If price repeatedly trades down into the area and bounces, chart readers say the level has “held.” If price trades through and remains below, the level has “failed” or been “broken.”
The idea of a support zone acknowledges slippage, volatility, and the mix of participant timeframes. Different traders anchor to slightly different prices. Some focus on prior lows, others on closing levels, round numbers, or areas with high historical volume. The observed support area thus reflects overlapping interests and a small range where demand and perceived value converge.
Why Support Emerges
Order Flow Mechanics
Prices move because trades occur at the margin. A decline continues only if sellers can transact at progressively lower prices. Support appears when enough buy orders rest at or below current price to absorb that selling. These are often passive limit orders that create liquidity. When a wave of market sell orders hits those bid orders, the impact on price diminishes, and the decline may slow or halt. If aggressive buying then enters, the market can rebound from that area.
In microstructure terms, support forms where the order book is deeper or where new liquidity repeatedly steps in. On charts, this can coincide with prior lows, consolidation floors, or price zones that attracted heavy trading in the past. The repetitive nature of liquidity provision at these areas gives support its observable character.
Behavioral Anchors
Support also has a behavioral dimension. Market participants frequently reference prior lows or psychologically notable prices such as round numbers. If a stock previously met strong demand near 50, some participants will remember that level. When price returns to the area, they may attempt to buy again, reinforcing demand. Longholders who missed a chance to add may now act. Short-term traders who sold higher may cover into the area to manage risk. These behaviors are not universal, but they are common enough to leave a footprint on the chart.
How Support Appears on Charts
Support has several common visual signatures. None of these are guarantees, but together they describe typical behavior at a support zone.
- Repeated lows at a similar price band. Price tests a floor multiple times without sustained follow-through lower.
- Lower wicks on candlesticks. Intraday or intra-bar selling probes below an area that then reverse before the close, leaving tails beneath bodies.
- Congestion or basing. Price trades sideways along a floor with overlapping bars and reduced net progress downward, signaling absorption.
- Volume characteristics. Activity can increase on touches of support as transactions concentrate. In some cases, a bounce from support occurs on expanding volume, although volume patterns vary across markets and timeframes.
- Round numbers or prior swing lows. Historical reference points often coincide with observable floors, even if the exact low differs by a modest margin.
Charts display support as a horizontal band in many cases. Traders often draw a rectangle that spans the area defined by the cluster of lows and closing prices around the floor. In intraday contexts, the band can be narrower because volatility is typically lower per bar. In more volatile environments, the band widens to accommodate larger intrabar excursions.
Horizontal and Dynamic Support
Horizontal support describes a relatively flat price zone derived from prior lows, consolidation floors, gap fills, or high-activity ranges. It is the most common representation in textbooks and charting platforms.
Dynamic support refers to a zone that shifts over time with trend and volatility. Examples include rising trendlines, moving averages, or anchored measures of average price such as a volume-weighted average price. The key idea is that demand appears not at a fixed number but along an evolving path. On a rising trendline, for instance, buyers may appear at progressively higher prices that align with the slope of the trend.
Both forms aim to capture where demand might be active. Horizontal levels emphasize historic price memory. Dynamic references emphasize how market participants adapt to changing conditions. In practice, many charts show a combination of both, such as a rising market that pauses at a former consolidation floor that now sits near a rising average.
Timeframe Considerations
Support is relative to timeframe. A daily support zone can differ from an intraday one, and a weekly level may outweigh both. The meaning of a level gains or loses influence based on the participants who helped create it. Weekly and monthly levels aggregate the actions of longer-horizon investors and often involve more volume, so they can exert a stronger pull on shorter timeframes.
Conflicts between timeframes are common. A five-minute chart might show a break of a local floor while the daily chart still sits well above a higher-timeframe support band. In that case, what appears as a breakdown in a very short window may be a minor fluctuation within a larger zone of demand. Reading support correctly involves understanding which timeframe is most relevant for the analysis at hand.
Precision and the Width of Support Zones
Support is rarely a single price. The width of the zone depends on volatility, market structure, and how prices traded within the area in the past. A practical way to think about width is to consider the distance between the lowest lows of the tests and the typical closing prices during those tests. Some analysts gauge width relative to recent average true range so the band reflects current volatility conditions.
Precision also depends on how levels are validated. Some observers anchor more weight to daily closing levels, reasoning that closes represent where the market agreed to value at the end of a session. Others emphasize intraday extremes, arguing that the willingness to transact at those extremes matters. In reality, both viewpoints can add context. A market that repeatedly trades below a level intraday but closes above it is signaling rejection of lower prices, at least during those sessions.
Volume and the Character of Support
Volume can provide clues about the quality of support, though interpretations should be cautious. Common observations include the following:
- Increased activity at support may indicate active two-way trade and absorption, with buyers willing to transact against selling pressure.
- A sharp rebound off support accompanied by rising volume may suggest greater participation in the reversal. The lack of rising volume does not negate support, but it may imply a less forceful reaction.
- On retests, a drop in selling volume near the same area can imply seller exhaustion. Conversely, a strong influx of volume on a break may reflect acceptance of lower prices.
These volume cues do not guarantee outcomes. They offer a descriptive layer that helps explain how participants are engaging at the level. The interplay between price and volume can hint at whether a market is absorbing pressure or transitioning to a new range.
Breaks, Holds, and False Breaks
Three broad outcomes can follow a test of support. The market can hold and bounce, it can break and accept lower prices, or it can briefly break and then reverse. The last case is commonly labeled a false break. Each outcome reflects tension between supply and demand.
A hold occurs when price trades into the zone and then moves away, leaving the area intact on subsequent bars. The structure of the hold can vary. Sometimes price moves sharply away. Other times price stabilizes and forms a base before drifting higher. In both cases, the market has not accepted lower prices at that time.
A break involves trading through the zone and demonstrating acceptance below it. One way to think about acceptance is to look for continued trading and closing activity below the former support, ideally with some time spent there. Mere ticks below the level are not enough to conclude acceptance, especially if price quickly returns above.
A false break occurs when price moves below support, draws in activity at lower prices, and then quickly reclaims the zone. On candlestick charts this often leaves long lower wicks at or below the former floor. False breaks are common in choppy markets where liquidity is thin or where stops rest just below visible levels. The key distinction is not that the level predicted a reversal but that the market tested lower prices and rejected them.
Role Reversal: From Support to Resistance
Once a support zone is broken and the market accepts lower prices, that area can act as resistance on subsequent rallies. This role reversal reflects the memory of participants who transacted near the level. Those who bought at the broken support and now hold losses may look to reduce exposure when price returns to their entry area. Sellers may also reengage there. The combined interest can create selling pressure that caps price below the former floor. The reverse effect can occur when resistance breaks and later acts as support.
Context Matters: Trend, Structure, and Confluence
Support does not exist in isolation. The context of the trend, the broader market structure, and the presence of other reference points matter to interpretation. For example, support that aligns with a rising trendline, a prior consolidation floor, and a round number may attract more attention than a single reference on a thinly traded chart. This is often described as confluence.
Trend context can also change how market participants interpret a level. In a downtrend, support tests may fail more often because the prevailing pressure favors lower prices. In an uptrend, pullbacks into support may stabilize more frequently because the marginal buyer is more active. These are descriptive tendencies rather than rules.
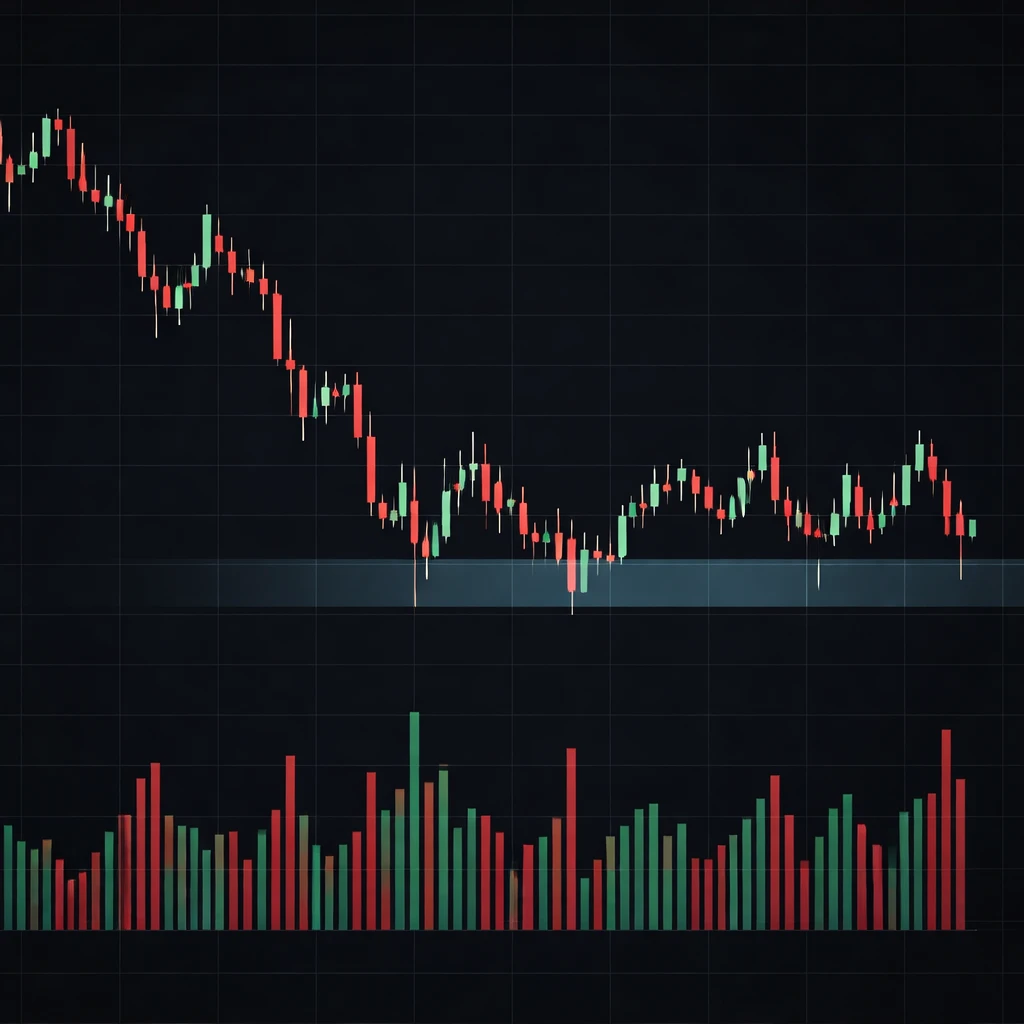
Practical Chart-Based Example
Consider a hypothetical equity that traded between 48 and 55 over several weeks. After an earnings release, price sold off from 55 to 50, where it found buying interest. Over the next two weeks, price made multiple intraday lows between 49.80 and 50.20 but closed most days near 51. On a daily candlestick chart, the zone around 50 appears as a floor with several lower wicks beneath 50 and bodies that finished above it. Volume increased on the initial drop to 50, suggesting active two-way trade as sellers met bids. On subsequent tests, volume tapered slightly, indicating less urgent selling.
During the third week, price briefly traded to 49.60 before reversing back above 50 by the close. The candle shows a long lower wick, which many chart readers would interpret as rejection of lower prices. The following sessions stabilized between 50.50 and 52, and the earlier floor remained visually intact. In this example, support is best drawn as a band from roughly 49.60 to 50.20, capturing both the extremes and the cluster of closes near the round number.
This scenario illustrates several points. First, support often forms around round numbers because participants anchor to them. Second, the width of the zone reflects volatility observed in the tails. Third, the difference between intraday probes and daily closes can signal whether the market is accepting or rejecting lower prices. None of these features guarantee any particular future move. They simply provide a structured way to interpret what the market did as it encountered a known reference.
Strength and Durability of Support
Analysts frequently debate what makes a support zone “strong.” Several descriptive factors are often cited:
- Number of tests. Multiple touches can validate a level as a reference, although too many tests can also weaken it by consuming available demand.
- Time spent at the level. Extended basing can indicate deeper two-way trade and stronger memory, but it can also signal distribution if sellers dominate.
- Magnitude of reactions. Larger and more sustained moves away from the level imply meaningful interest from buyers.
- Volume and participation. Higher volume during holds can indicate significant involvement, while thin bounces may reflect limited interest.
These factors are descriptive rather than definitive. Markets can break the most widely watched levels without warning. The idea of strength should be treated as a probabilistic and contextual description, not as a promise of future behavior.
Gaps, Profile, and Other Sources of Support
Support often aligns with structural features on the chart beyond obvious swing lows.
- Gap floors. The top of a large upside gap can later behave as support if price returns to fill part of the gap. The untraded area and the memory of the initial move can concentrate interest near the gap boundary.
- High-volume nodes. In markets where volume-by-price information is available, price zones with significant historical activity can act as support because they reflect prior acceptance of value.
- Anchored averages. Measures like anchored volume-weighted average price are sometimes used to identify the average price of transactions from a particular event. If price trades below that reference and then returns to it, some participants perceive it as a fair area to transact, which can overlap with support.
These references add depth to the analysis by identifying areas where the market previously did significant business or where participants might anchor. They are complements to the basic observation of repeated lows and congestions.
Common Misconceptions
Several misunderstandings surround the idea of support:
- Support is not a guarantee. The market does not owe a bounce simply because a level is visible on a chart. Levels can and do fail.
- Support is a zone, not a line. Treating it as a single price often leads to unrealistic precision and disappointment when minor breaches occur.
- More tests are not always better. While additional tests can validate a level, they can also weaken it by exhausting demand.
- All breaks are not equal. A brief tick below support during illiquid hours is different from a sustained break on heavy participation with multiple closes below the zone.
- Higher-timeframe context matters. A local support on a short chart can be insignificant within a larger downtrend that is still dominant.
Interpreting Support Without Implied Strategy
Support provides a language for describing what the market is doing at known reference points. It helps organize observations like: Are sellers being absorbed at this price area, or are they pushing through? Is the market spending time below a former floor, or rejecting those prices and closing back above? Are reactions from the area growing or diminishing over successive tests? These questions guide interpretation without implying a specific course of action.
Using support as a descriptive tool encourages disciplined observation. It focuses attention on the interaction between price and volume, on the shape and duration of trades near key areas, and on how the market transitions from balance to imbalance. By concentrating on what the market is showing at these zones, analysis becomes more about evidence and less about speculation.
Limits of Support-Based Interpretation
Support captures only part of the picture. Macro events, liquidity conditions, and cross-asset influences can overwhelm local levels. In fast markets, price can gap through a widely watched floor without spending time there, leaving little chance for the level to play a visible role. Cor-related assets can also alter behavior around support. For example, an index-level shock often changes how constituents behave near their individual floors.
Data quality and chart scale further complicate interpretation. Different platforms may show slightly different highs and lows, especially in decentralized markets. Log versus linear scaling can change the perceived importance of levels on long-term charts. Being aware of these limitations helps prevent overconfidence in any single chart feature.
A Note on Language: Support vs. Demand
Some analysts prefer the term demand zone instead of support. The distinction is mostly semantic. Support is the more common chartist term, while demand zone emphasizes the underlying supply-demand dynamic. Both refer to areas where buying interest has recently been sufficient to halt declines.
Putting It Together
Support, as an interpretive framework, is about observing how the market behaves at prices where demand has shown up before. The concept integrates price structure, volume behavior, time at level, and multi-timeframe context. When analyzed carefully, it helps distinguish between temporary pauses and meaningful rejections, between shallow reactions and durable basing, and between mere probes and accepted breaks.
Key Takeaways
- Support is a price zone where declines have historically slowed or reversed because demand absorbed selling pressure.
- It appears on charts as repeated lows, lower wicks, congestion near a floor, and often aligns with prior swing lows or round numbers.
- Support is probabilistic and contextual, not a guarantee. Acceptance below a zone signals a break, while quick reversals suggest rejection.
- Timeframe and volume matter. Higher-timeframe support and participation patterns can change the significance of a level.
- Treat support as a descriptive tool for interpreting market behavior rather than as a standalone basis for prediction.