Role reversal is a foundational idea in technical analysis. It describes how a price level that previously acted as resistance can later function as support after price moves above it, and how a former support level can later behave as resistance after price moves below it. This pattern reflects changes in market participation and the shifting balance between buying and selling interest around well-known price levels. Understanding role reversal helps an analyst interpret price behavior and organize market information without prescribing specific trades or outcomes.
Defining Role Reversal
Support is a price region where declines have historically slowed or reversed, implying concentrated buying interest or a lack of aggressive selling at that level. Resistance is a region where advances have historically slowed or reversed, implying concentrated selling interest or a lack of aggressive buying. Role reversal occurs when a break through one of these regions is followed by a later interaction in which the old resistance acts as a floor from above, or the old support acts as a ceiling from below.
In practical terms, if price consolidates under a well-observed resistance, breaks above, and later revisits that region from higher ground, analysts often look to see whether that area now behaves like support. The same logic applies in reverse when price breaks below a noted support and then rallies back to it. The former support is observed for resistance-like behavior. The core idea is not mystical. It is an expression of market memory, order placement, and how participants respond when the market revisits a level with a different inventory of positions.
Why Role Reversal Matters
Analysts pay attention to role reversal because it can reveal shifts in the balance between supply and demand. When a market breaks beyond a well-telegraphed level and later tests it from the other side, the response often communicates whether the market accepts the new range or rejects it. Acceptance suggests the market is comfortable transacting at or above the former resistance when revisited, while rejection suggests the level still carries opposing pressure.
Role reversal also concentrates attention. Many participants anchor their expectations to specific levels that have been repeatedly observed in price history. That shared focus can lead to clusters of resting orders, which in turn can make the reaction around a retest more informative. Importantly, the concept does not guarantee continuation. It is a framework to interpret market behavior, not a prediction by itself.
How Role Reversal Appears on Charts
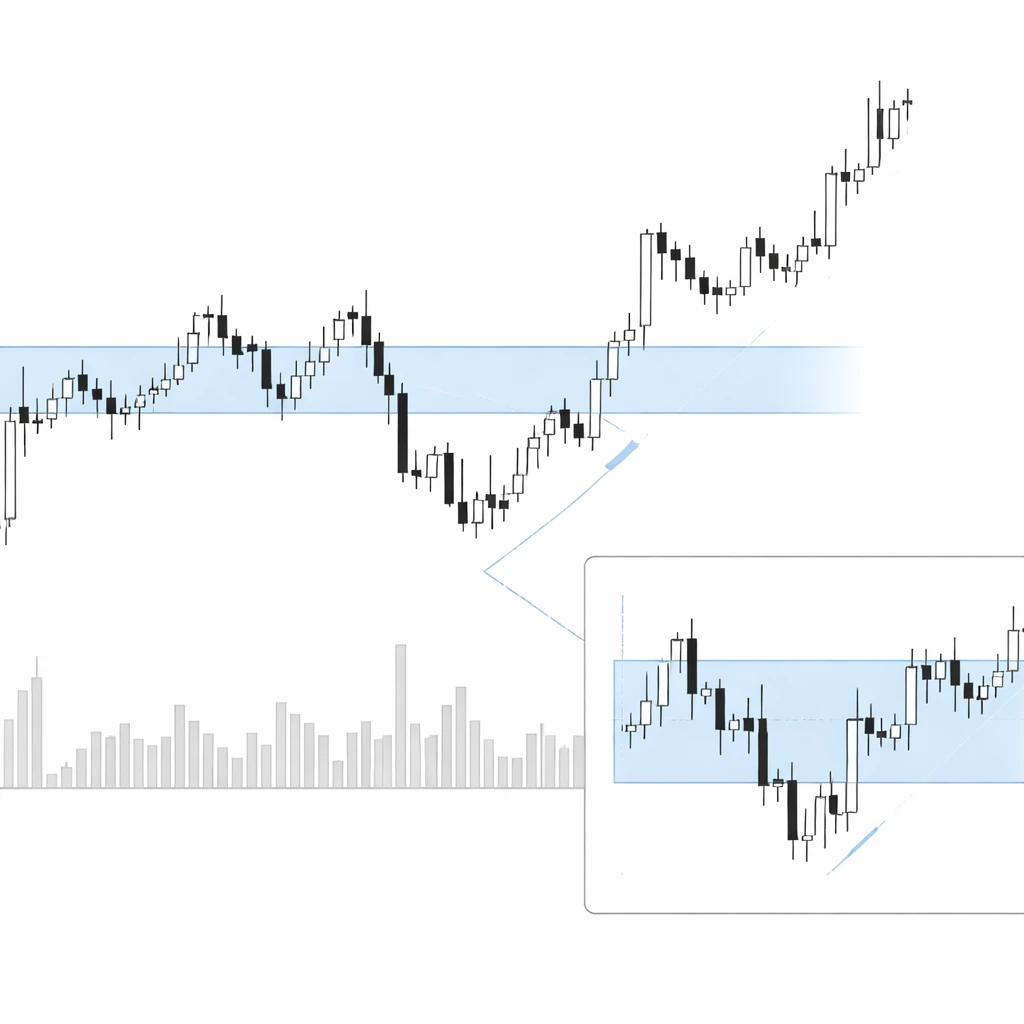
On a chart, role reversal usually unfolds in three steps:
- Price recognizes a level as support or resistance through repeated reactions. This creates a visible horizontal zone defined by prior pivot highs or lows.
- Price breaks through the level with decisive movement. Many analysts prefer to see a closing price beyond the level rather than a fleeting intraday excursion.
- Price later returns to the level from the opposite side. The market either turns away from the level, consolidates at it, or slices through it again. The nature of this interaction is what analysts study.
These steps can occur on any timeframe. A 5-minute chart can exhibit role reversal just as a weekly chart can. The informational value often scales with the significance of the level. A level defined by months of trading and several distinct reactions typically carries more interpretive weight than a level formed over a few hours. That said, shorter timeframes can still be relevant for intraday interpretation.
Microstructure and Behavioral Rationale
The rationale behind role reversal can be understood through order flow and behavior:
- Trapped positions and regret. Traders who sold at a level that used to be resistance may want to buy if price rallies above that level and later revisits it, either to exit shorts at break-even or to align with the new direction. That behavior can create demand near the retest.
- Anchoring and salience. Highly visible levels become psychological anchors. Even participants who do not explicitly use technical rules notice round numbers or prior highs and lows, which can influence their order placement.
- Inventory and liquidity. Large players often manage inventory around known levels because these are areas where liquidity is deeper. When price returns to a former resistance from above, buy orders may already be resting there, reinforcing support-like behavior.
- Stop and take-profit placement. Stops and targets often cluster around prominent levels. The triggering of these orders during a retest can amplify the initial reaction and make the reversal of role more visible.
Levels as Zones, Not Single Prices
While charts often display a clean horizontal line, most levels are better understood as zones. Markets are noisy, and few instruments pivot at the exact same tick repeatedly. The width of a zone can be thought of in relation to typical volatility. Some analysts gauge tolerance by referencing recent average true range or the typical size of intraday swings, then allow for some deviation around the central level. The idea is to distinguish between a minor breach inside the noise band and a meaningful violation that indicates the level is not holding.
Treating support and resistance as zones helps interpret role reversal accurately. A retest that dips slightly into the zone before turning higher may still be consistent with the concept. Conversely, a sustained move well beyond the zone, with several closes on the other side, suggests the level has failed to reverse its role.
Immediate and Delayed Retests
Role reversal does not require an immediate retest. Sometimes the market breaks through a level and continues far before returning. In such cases the retest can still carry interpretive value, though conditions may have changed. Time gaps introduce new information, such as economic releases, earnings, or shifts in sentiment. An immediate retest can highlight whether the breakout was accepted quickly, while a delayed retest can test market memory after participants have rebalanced positions.
False Breakouts and Failed Role Reversal
Not every break beyond a level leads to role reversal. A common outcome is a false breakout. Price pushes beyond the level briefly, then returns decisively back through it. If price later approaches the level again, the prior attempt may lessen confidence that the level will hold as the opposite role. Markets can also overshoot on one side during periods of thin liquidity or news-driven volatility, then revert. Failed role reversal is informative. It tells the analyst that the shift in supply and demand did not persist beyond the initial move.
Illustrative Chart Contexts
Consider a stock that has repeatedly stalled near 50. Over several weeks, rally attempts have turned back at or just under this figure, making 50 a visible resistance zone. After a strong earnings report, the stock closes at 52 with above-average volume. Two sessions later, it retreats to the 50 area and finds buyers. Intraday dips to 49.80 are absorbed, and the session closes above 50. In this sequence, 50 acted as resistance before the report, then after the breakout, it acted as support upon the retest. Whether price advances afterward is separate from the role reversal observation. The key point is that former selling pressure did not reassert when price returned from above, which indicates a change in market behavior around that level.
As another example, imagine a currency pair that consolidated between 1.1900 and 1.2000 for several weeks. The 1.1900 area served as support, with several bounces. After a central bank communication that surprised the market, the pair broke below 1.1900 and closed at 1.1860. Two days later it rallied back toward 1.1900 and stalled. Sellers emerged around 1.1895 to 1.1910, and the market rolled over. Here, former support behaved as resistance. The market signaled that bids which had held the range earlier were now absent or overwhelmed.
Index levels often illustrate the same idea. An equity index might struggle to overcome a prior swing high for months. When a robust macro catalyst pushes it above, the next period sometimes sees a modest decline back to that high. If the index stabilizes near the old high and turns up, analysts describe the level as having flipped from resistance to support. If the index slices back under and accelerates lower, they note the failure of the role reversal and reassess the context.
Evaluating the Credibility of a Role Reversal
Analysts commonly evaluate several aspects when judging how meaningful a role reversal might be in descriptive terms:
- How established was the level. A level defined by multiple clear reactions and separated in time is generally considered more notable. One isolated pivot is less compelling.
- Quality of the break. Did the market close beyond the level, or only probe it briefly. Was the move accompanied by range expansion or heavier activity, signaling genuine interest.
- Nature of the retest. Did the market turn away promptly upon revisit, or did it churn around the level, hinting at indecision. Was the reaction constrained within the expected zone width.
- Broader context. Trend strength, macro catalysts, and liquidity conditions can all influence how much weight to assign to a level. Context does not determine the outcome, but it frames the interpretation.
Volume can be informative where available. A breakout with increased participation followed by a retest that holds on normal or lighter activity often suggests the market did not meet significant opposition at the level during the revisit. In contrast, a retest that fails on heavy activity can imply that the level attracted renewed opposing pressure.
Multiple Timeframe Considerations
Role reversal occurs across timeframes. A daily resistance that flips to support can coexist with an intraday level doing the opposite. Analysts often study higher timeframes to establish the major zones, then observe lower timeframes for how price interacts during approaches and retests. Conflicts between timeframes are common. A minor intraday failure does not necessarily contradict a larger weekly role reversal that remains intact. Clarity improves when the same level is visible on several timeframes and price responds consistently across them.
Instrument characteristics also matter. In thinly traded markets, levels can appear to break and reverse erratically due to sparse liquidity and wider spreads. In highly liquid markets, reactions at notable levels may be more orderly. Neither environment guarantees clean behavior, but it affects how precisely one should expect price to respect a level.
Role Reversal with Gaps and Ranges
Price gaps often create prominent reference areas. The top of a downside gap can act as resistance on a subsequent rally. If price later breaks into and above that gap, the upper boundary can flip to support on a retest. Range boundaries behave similarly. When price trades for an extended period within a range, both the top and bottom accumulate market memory. A successful escape from the range sets the stage for potential role reversal when the market returns to examine the boundary it crossed.
Precision, Tolerance, and Volatility
Expect some imprecision around any level. A tolerance band accommodates normal volatility and charting artifacts. One way to think about tolerance is relative to the typical bar size. If daily bars average 1.5 percent from high to low, a 0.1 percent overshoot may be immaterial. On a 5-minute chart with much smaller bars, the same absolute overshoot could be meaningful. The point is to calibrate expectations to the instrument and timeframe under study rather than insisting on exact price equality.
Several retests can occur before a level truly flips its role, and some flips are short-lived. Markets evolve as news and positioning change. Treat role reversal as a property that can strengthen or weaken depending on subsequent price action, not as a permanent label applied after a single event.
Common Misinterpretations
- Hindsight bias. Identifying a role reversal only after a large move can lead to overly confident conclusions. The concept is best used to organize observations in real time, acknowledging uncertainty.
- Overfitting thin evidence. A level touched once or twice in a noisy environment may not carry much meaning. Demanding the same respect from such a level as from a well-tested one can mislead.
- Confusing probes with breaks. A brief intraday push a few ticks beyond a level does not necessarily constitute a break that sets up role reversal. Closing behavior and the depth of the move often provide better information.
- Ignoring context. A news shock can overwhelm technical structures. If a major event changes the market’s information set, a textbook role reversal may fail without implying the concept is flawed.
- Assuming symmetry. The strength of a flip from resistance to support does not imply an equally strong flip from support to resistance in the same range. Conditions differ each time.
Practical Observations Without Strategy
Analysts who study role reversal often organize their charts and notes around neutral observations rather than prescriptive steps. Examples include:
- Document the history of reactions at a level, noting the dates and approximate highs or lows that define the zone.
- Record whether the eventual break occurred with expanding range or noticeable participation, compared with recent averages.
- Describe the first revisit. Was it immediate or delayed. How deep was the probe into the zone relative to recent volatility. Did the market turn promptly or hesitate.
- Note whether the behavior repeated on subsequent visits. A single flip may be followed by further flips as conditions evolve.
- Track any relevant catalysts around the break and retest to understand whether the reaction is likely to be specific to that news or part of a broader shift.
This type of record keeping refines an analyst’s sense for how an instrument typically treats levels. Different markets can exhibit different personalities. Some respect zones with remarkable consistency. Others wander within wide noise bands before revealing intent. Role reversal as a lens maintains its usefulness across these differences because it focuses on the interplay between level recognition, break quality, and retest behavior.
Extending the Concept
Although most discussions center on horizontal levels derived from prior highs and lows, role reversal can appear with other reference points. For example, the upper boundary of a channel can later function as support after an upside break and retest from above. The same can occur with the lower boundary of a channel after a downside break. Some analysts also consider the edges of large consolidation patterns such as triangles or rectangles. The underlying principle remains constant. If the market had trouble traversing a boundary previously, then later overcomes it and treats it as a staging area upon return, the boundary has arguably switched roles.
That said, horizontal levels are typically the most widely observed and often the cleanest to study, because they align with natural human attention to prior extremes and round numbers. Complexity in sloped or curved structures can make the definition of a retest less precise.
Interpreting Failure Around Former Levels
Failure at a retest can be as informative as a clean hold. Suppose price breaks above a widely watched resistance and then revisits it from above. If the market spends several sessions below the level after the retest and cannot reclaim it, analysts might infer that the breakout lacked acceptance. The idea is not to insist on a specific forecast, but to recognize that the market treated the level as resistance again despite the earlier break. Observing this failure can prompt a reassessment of how strong the prior breakout appeared and whether the underlying drivers have faded.
Similarly, a brief dip below former support followed by a rapid recovery and firm trading above the level might suggest the market rejected prices below the zone. The flip back to support in that case can still fit within the role reversal framework, although the path was complex. The details of the path matter for interpretation, particularly in volatile conditions.
Documentation and Communication
One value of role reversal is communicability. Analysts, portfolio managers, and risk teams can discuss market structure succinctly by referencing whether a level has flipped and how price behaved on the retest. That shared vocabulary reduces ambiguity and helps integrate qualitative and quantitative inputs. Because the concept is chart-based and observable, it supports structured note-taking and post-trade review without relying on forecasts.
Putting It All Together
Role reversal captures a consistent pattern in how markets interact with well-known levels. The quality of evidence matters. A level with a documented history, a decisive break, and an informative retest provides more reliable context than a line drawn through a single pivot. Reactions can fail, and sometimes the market provides no retest at all. In other cases the retest happens multiple times, with alternating outcomes as conditions shift. None of these possibilities undermine the usefulness of the concept for organizing information. They simply reflect that markets are adaptive systems where order flow and expectations evolve.
Used carefully, role reversal helps an analyst translate chart behavior into observations about acceptance, rejection, and liquidity concentration. Those observations carry value for scenario planning, risk framing, and communication. The concept is modest in scope but powerful in practice because it captures recurring interactions between collective memory and current positioning.
Key Takeaways
- Role reversal describes a former resistance acting as support after an upside break, and a former support acting as resistance after a downside break.
- The concept reflects market memory, order placement, and changes in the balance of supply and demand around visible levels.
- Levels are better treated as zones with volatility-aware tolerance rather than single precise prices.
- Break quality and retest behavior provide useful information, but outcomes vary and failures are common, especially around news or in thin markets.
- Role reversal is an interpretive framework for structuring observations, not a guarantee of direction or a standalone trading signal.