Support and resistance levels occupy a central place in technical analysis because they summarize where buyers and sellers previously contested price. At these key levels, the market often pauses, reverses, or accelerates. Yet price does not always move cleanly through a level when it is eventually tested. A common and informative event is the false break at a key level, a brief excursion beyond support or resistance that fails to find follow-through and returns back inside the prior range. Understanding this behavior helps interpret conviction, liquidity, and the character of the prevailing market environment without implying any specific trading action.
Defining a False Break at a Key Level
A false break occurs when price moves beyond a clearly defined support or resistance level but does not sustain that move. The market pushes through the level, attracts activity, and then reverses back through the level into the prior range. The defining element is failure of continuation rather than the magnitude of the initial breach.
Two clarifications are essential for a precise definition:
- Reference level: The level under test should be clearly established beforehand. Common references include prior swing highs or lows, multi-touch horizontal zones, round numbers, the top or bottom of a range, or the high or low of a well-observed session or week.
- Sustainability criterion: A breach that fails can be judged by closing behavior or by duration outside the range. Many analysts require a session close back inside the prior range to confirm the failure. Others require a minimum number of bars back inside, or a percentage retrace, to avoid labeling every brief fluctuation as a false break.
Under these conditions, a false break is less about a specific candlestick label and more about a sequence: approach a level, move through it, fail to find follow-through, and return to the prior zone.
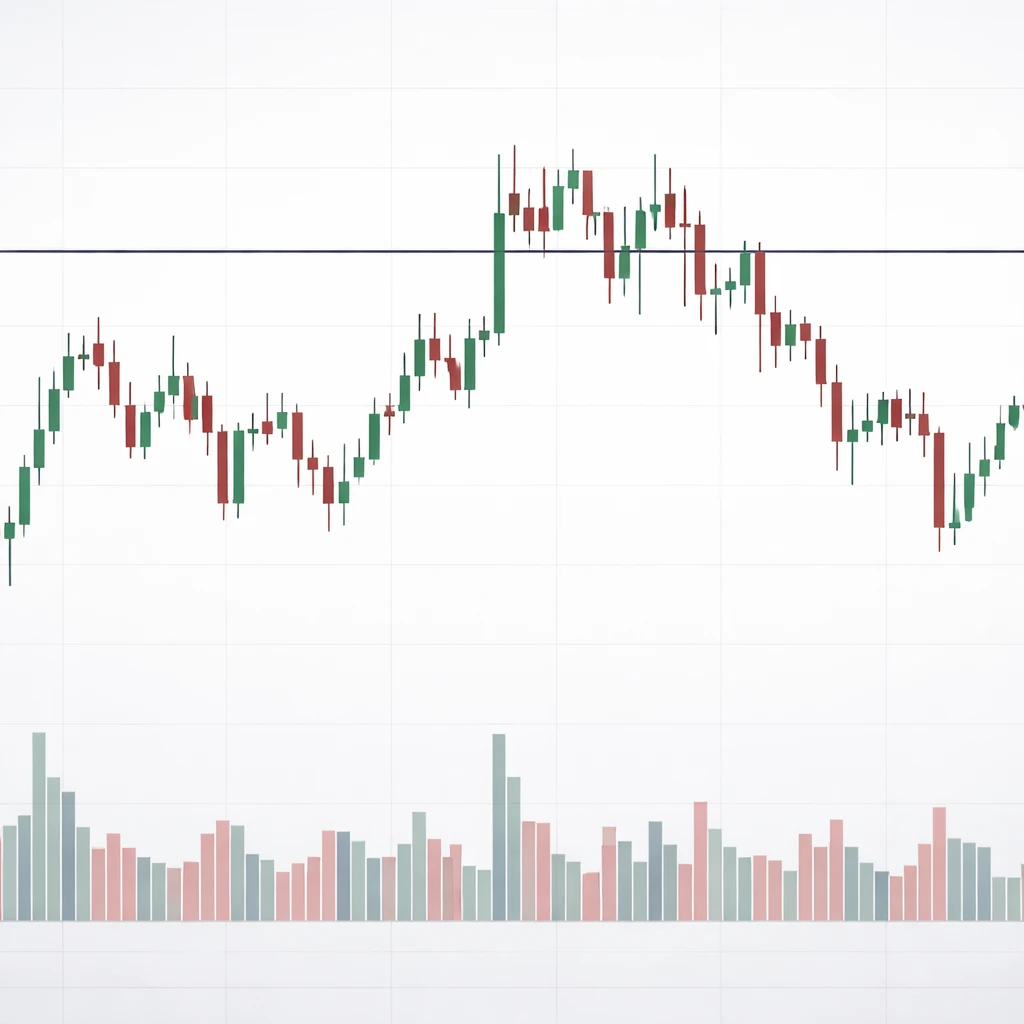
How False Breaks Appear on Charts
On the chart, the most visible signal is the pattern of highs, lows, and closes relative to a horizontal level. The appearance can vary by timeframe and volatility regime:
- Intrabar excursion: Price briefly trades beyond the level intraday but closes the bar back inside the range. This often produces a long wick on the side of the attempted breakout.
- One- to two-bar overshoot: Price closes beyond the level once, sometimes twice, then closes back through the level into the prior range. This can form a small cluster of bars straddling the level.
- Gap-through followed by fill: Price gaps over resistance or under support at the open but trades back to and through the level during the session. The day closes inside the previous range despite the gap.
Candlestick bodies relative to the level carry informational weight. A close back inside the range, especially when the body is positioned firmly away from the level after the breach failed, signals that the market was unable to accept prices beyond the level. Long wicks beyond the level often indicate probing behavior where liquidity was found but not sustained.
Volume, when available, can add context. Breakout attempts on lower volume followed by a return on higher volume suggest that participation was stronger in the reversal than in the initial push. Conversely, a forceful breakout backed by high volume that nonetheless fails implies the presence of substantial opposing interest at or beyond the level.
Why Traders Pay Attention
Analysts observe false breaks because they reveal information about market acceptance, liquidity, and conviction:
- Acceptance versus rejection: Sustained trading beyond a level indicates market acceptance of new value. Failure to sustain the breach indicates rejection. The difference between acceptance and rejection helps interpret whether the prior range remains the dominant reference.
- Liquidity discovery: Price often probes beyond a level to locate liquidity resting in stop orders or pending orders. A quick return suggests that once liquidity was consumed, there was insufficient demand or supply to continue.
- Information about positioning: False breaks often coincide with crowded positions. If many participants are positioned for a breakout, a brief overshoot can trigger orders before reversing, which sharpens the subsequent move back into the range.
- Volatility structure: The tendency for levels to hold or to break and hold varies across regimes. A sequence of false breaks hints at range-bound dynamics, whereas clean break-and-hold events point to trending conditions.
Attention to this behavior does not imply prediction. It frames how to read market responses to well-watched levels and how to interpret the durability of price discovery beyond those levels.
Support, Resistance, and the Role of Timeframes
The meaning of a false break depends strongly on timeframe. A move that looks decisive on a one-minute chart can be noise on a daily chart. Conversely, a daily close back inside a level carries more weight than a brief intraday flicker because it reflects a wider set of participants and closing behavior.
Several nuances commonly arise:
- Higher-timeframe levels: Levels that formed over many sessions or weeks usually attract more attention. A false break at a weekly swing high says more about broad participation than one around a single intraday peak.
- Zone versus line: Markets respect zones more often than precise ticks. A false break can be defined with respect to a band around the level rather than a single price. The width of the zone often corresponds to recent volatility.
- Multiple tests: The more times a level is tested, the more likely it is to attract orders and attention. Repeated tests can increase both the probability of an actual break and the odds of noisy overshoots. The behavior of each test needs to be evaluated in context.
Microstructure and Behavioral Drivers
False breaks reflect how orders are discovered and matched. Liquidity does not sit uniformly across prices. It often clusters near obvious reference points such as recent highs, lows, and round numbers. When price approaches a level, several order types may be present: stop orders from participants who entered earlier, limit orders anticipating a reversal, and breakout orders seeking continuation.
Two broad mechanisms tend to interact:
- Stop-driven probing: A push beyond a level can trigger stops. This releases a pocket of liquidity that temporarily fuels the move. If there is not enough follow-on interest once those stops are absorbed, price may revert quickly back inside the prior range.
- Mean reversion by larger participants: Larger participants may provide liquidity at prices that they view as unfavorable extensions. Their activity can absorb the breakout and cause price to rotate back toward the prior area of value.
Behavioral tendencies also play a role. Prior peaks and troughs are salient and become focal points for expectations. The visibility of a level can lead to clustering of orders. When many are watching the same reference, price moves around it can become more dramatic and more subject to short-lived excursions.
Recognizing False Breaks Without Overfitting
Because markets are noisy, any attempt to formalize false breaks needs clear criteria that fit the instrument and timeframe. Common elements include:
- Magnitude threshold: Define the minimum distance that price must trade beyond the level to count as a breach. This can be a fixed number of ticks or a fraction of recent average true range.
- Time threshold: Specify how long price must remain outside the level before the return qualifies as a failure. Some prefer at least one close outside followed by a close back inside. Others use intraday rotations measured in minutes or bars.
- Re-entry definition: Clarify what constitutes a return into the prior range. A mere touch of the level followed by more oscillation may not indicate rejection.
- Context filters: Consider whether broader trend, news flow, or volatility regime is part of the classification. Context filters help prevent labeling as false breaks the moves that occur during structural trend progression or around scheduled events.
These elements aim to reduce ambiguity in categorization and to support consistent interpretation across time.
Chart-Based Context and Examples
The same phenomenon can look different across markets and timeframes. The following examples illustrate the concept without prescribing actions.
Example 1: Daily chart at a prior swing high
Consider a stock that traded for several weeks between 48 and 52. After multiple tests of 52, price breaks to 52.80 on a strong open and closes at 52.10. On the next day, the stock rallies early to 52.40, then sells off and closes at 51.50. Price has traded beyond resistance but quickly returned to the prior range. The sequence shows that the market explored higher prices, found supply, and failed to accept the new area as value. The relevant features are the brief time spent above 52, the closing position back in the prior range, and the presence of two tests that both failed to hold gains.
Example 2: Intraday futures around an opening range
On a five-minute chart, the first thirty minutes set an opening range in an index future. During the late morning, price pushes five points above the opening range high, prints several bars with long upper wicks, and then rotates back inside the range. Volume increases during the failed push and remains elevated on the return. The sequence suggests that the higher prices attracted selling interest sufficient to absorb the attempt to discover value above the range.
Example 3: Round number behavior in foreign exchange
An exchange rate consolidates just below a round number such as 1.1000 after trending higher for days. A brief spike during a data release prints 1.1012, but the hour closes at 1.0980. The following hours continue to close below 1.1000. Here the round number acted as a focal point, and the news-driven excursion failed to win acceptance. The chart would show a wick above the round number and subsequent closes back under the level, which professional observers often classify as a failed attempt rather than a sustained breakout.
Example 4: Support under pressure during risk-off headlines
A commodity has a well-defined support zone around 72 based on several daily lows and a consolidation base. A negative headline triggers a fast drop to 71.60. Within the same session, the commodity recovers to close at 72.40. The market traveled below support, located liquidity, and then returned. The behavior around the level indicates that despite adverse news, the area still attracted buying interest sufficient to reestablish the prior range for the close.
Interpreting the Information Content
A false break suggests that the market does not yet accept prices beyond the level as fair value. This is an information statement, not a prediction. It addresses the balance of participation and the quality of the move rather than its next step. Several elements often inform interpretation:
- Relative speed: Rapid failures after breaks convey a different tone than drawn-out hesitation. Quick reversions indicate that responsive participants acted decisively when prices extended.
- Closes versus wicks: Closes back inside the range are a stronger sign of rejection than wicks that end near the level. Closing behavior compresses the actions of many participants over the session.
- Volume and breadth: In equity indices, breadth metrics, when available, help contextualize whether a failed breakout is broad-based or concentrated in a few names. Increased volume during the reversal suggests higher conviction from the side opposing the breakout.
- Repeat attempts: Multiple failed attempts at the same level can mean the level remains important. It can also indicate that the market is coiling energy. Whether the level ultimately breaks and holds is an empirical question, not a foregone conclusion.
Relation to Other Technical Ideas
False breaks are closely related to several familiar concepts:
- Throwback and pullback: After a true breakout, markets sometimes return to test the broken level from the other side. When that test holds, the prior level flips role. A false break differs because the initial breach never established acceptance, and the market returns more decisively into the prior range.
- Range rotation: In range-bound markets, price often alternates between the top and bottom of the range. False breaks at the edges reflect failed attempts to start a directional move out of the range.
- Wyckoff springs and upthrusts: Some classical frameworks label false breaks below support as springs and those above resistance as upthrusts. The underlying logic is similar. Price probes beyond a boundary and then returns, implying rejection.
Measuring and Cataloging False Breaks
Many analysts catalog examples to understand frequency and typical characteristics across instruments and regimes. A simple framework can help:
- Identify the level: Choose the reference high or low, or define a zone with a specific width based on recent volatility. Document how the level was selected to avoid hindsight bias.
- Define breach parameters: Record the maximum distance beyond the level, both in absolute terms and relative to average true range. Include how many bars closed outside.
- Record return dynamics: Note the time taken to return inside the level, the closing position relative to the level, and any volume changes during the reversal.
- Context variables: Include market regime markers such as realized volatility, proximity to earnings or macro events, and relationship to longer-term trend references.
By maintaining a catalog, it becomes possible to compare current market behavior to historical patterns without presuming that the same outcome will occur. The goal is to refine interpretation rather than to generate rules for action.
Common Misconceptions and Pitfalls
Several misconceptions can cloud analysis of false breaks:
- Every failed move is a false break: Not all failures are meaningful. Sometimes the level chosen is arbitrary or based on a single print. Levels should have clear prior relevance.
- Single-bar patterns suffice: Candlestick names can be tempting shortcuts, but context matters more than labels. The interaction of multiple bars, volume, and broader structure carries more information.
- Timeframe agnosticism: A false break on a short timeframe may be invisible on a higher timeframe. Without specifying timeframe, comparisons across examples can be misleading.
- Outcome bias: It is easy to highlight failures that preceded large moves in the opposite direction and ignore those that led to little follow-through. Balanced catalogs should include both dramatic and muted outcomes.
- Overfitting criteria: Highly specific thresholds tailored to a small sample can appear to work historically but may not generalize. Simpler, robust definitions help maintain consistency.
Selecting and Drawing Key Levels
Clarity in level selection improves the quality of interpretation. A few practical considerations can assist:
- Prefer levels with multiple touches: Multi-touch highs and lows indicate repeated relevance to market participants.
- Use zones in volatile markets: A narrow line often fails to capture the fuzziness of real trading. Zones anchored by clusters of highs or lows reflect where orders concentrated.
- Attend to closing levels: Closes around the reference level reveal where participants agreed to mark the period. Wicks show exploration, while closes show agreement.
- Be consistent: Apply the same logic across charts to avoid hindsight adjustments that inflate the apparent clarity of a false break.
Role of News and Scheduled Events
Scheduled data releases, earnings reports, and policy announcements frequently coincide with break attempts. News can generate temporary imbalances that push price through levels before the market reassesses. When cataloging false breaks around such events, it is helpful to note whether the move was news-induced and how quickly price stabilized afterward. A move that fails within minutes of a release tells a different story than a move that remains outside the level for several sessions before reversing.
Volatility Regimes and Market Conditions
Markets oscillate between quiet and turbulent conditions. The likelihood and character of false breaks often shift with volatility:
- Low-volatility ranges: In quiet periods, levels can be precise and clean. False breaks may be shallow and brief. The return to the range often looks orderly.
- High-volatility phases: In fast markets, overshoots are larger, zones are wider, and labeling becomes more difficult. A move that looks like a false break may instead be the first stage of price discovery in a new regime.
- Trending versus ranging: Persistent trends tend to resolve levels with break-and-hold behavior. Range-bound conditions invite more probing and failure. Recognizing the dominant condition can inform the interpretation of each breach.
Implications for Risk Framing and Expectation Management
Although this discussion does not prescribe strategies, the interpretive value of false breaks is clear. They communicate that the market attempted to explore beyond a well-observed boundary and found insufficient acceptance. That message can inform how observers frame scenarios, understand where reactions might cluster, and assess how much weight to place on a recent breach when evaluating subsequent price action.
Observers who track false breaks often monitor the pace of reversion, the location of closes, and the interaction with related references such as moving averages, prior gaps, or volume nodes. None of these elements dictates a course of action. They provide context for gauging whether the market is likely to treat the prior range as active or whether a new area of value is emerging.
Documentation and Review
Consistent documentation helps transform the concept from an anecdote into a structured analytical tool. Screenshots with timestamps, notes about the chosen level, and concise observations about the breach and return create a reference library. Over time, patterns emerge about which instruments and timeframes exhibit frequent false breaks, which conditions favor clean follow-through, and how long acceptance outside a level typically takes when it occurs.
Periodic review can include questions such as:
- How often did breaches beyond a level lead to sustained acceptance compared to quick rejection during the period?
- Did certain news categories coincide with a higher rate of false breaks?
- How did realized volatility during the period influence the width of zones and the frequency of overshoots?
- Were false breaks more common near round numbers or prior multi-week extremes?
These questions foster disciplined assessment without linking the answers to prescriptions or forecasts.
Putting It All Together
False breaks at key levels are best viewed as messages about market acceptance. A breach that fails communicates rejection of the attempt to reprice the asset beyond a familiar boundary. The event they describe depends on clear definitions of levels and sustainability, sensitivity to timeframe, and awareness of liquidity and behavioral dynamics. Chart appearance, volume patterns, and closing behavior provide the raw material. Cataloging and consistent criteria transform that raw material into a structured component of technical interpretation.
Because support and resistance attract attention, they are natural magnets for price exploration. False breaks are the subset of explorations that do not resolve into acceptance of new value. Recognizing them improves an analyst’s ability to characterize the current state of the market. It does not dictate what should be done, and it does not imply that a mirror-image move must follow. The principal value lies in the clarity it brings to the ongoing negotiation between buyers and sellers around meaningful prices.
Key Takeaways
- A false break occurs when price briefly trades beyond a well-defined support or resistance level but fails to sustain acceptance and returns to the prior range.
- Chart evidence includes wicks beyond the level, closes back inside the range, and often a shift in volume during the reversal.
- Context matters. Timeframe, volatility regime, and whether the level is a line or a zone all shape the interpretation.
- False breaks convey information about liquidity, positioning, and market acceptance without implying any specific next step.
- Consistent definitions and documentation help distinguish meaningful false breaks from routine noise.