Support & Resistance

Key price levels where buying or selling pressure historically emerges.

Part of Technical Analysis

What you will learn

This scope is designed to help you build a practical understanding of Support & Resistance. Lessons move from core definitions to real-world context and common failure points.

Lessons

Reading in order is recommended, but each lesson stands on its own.

10 min read
Beginner

What Is Support?

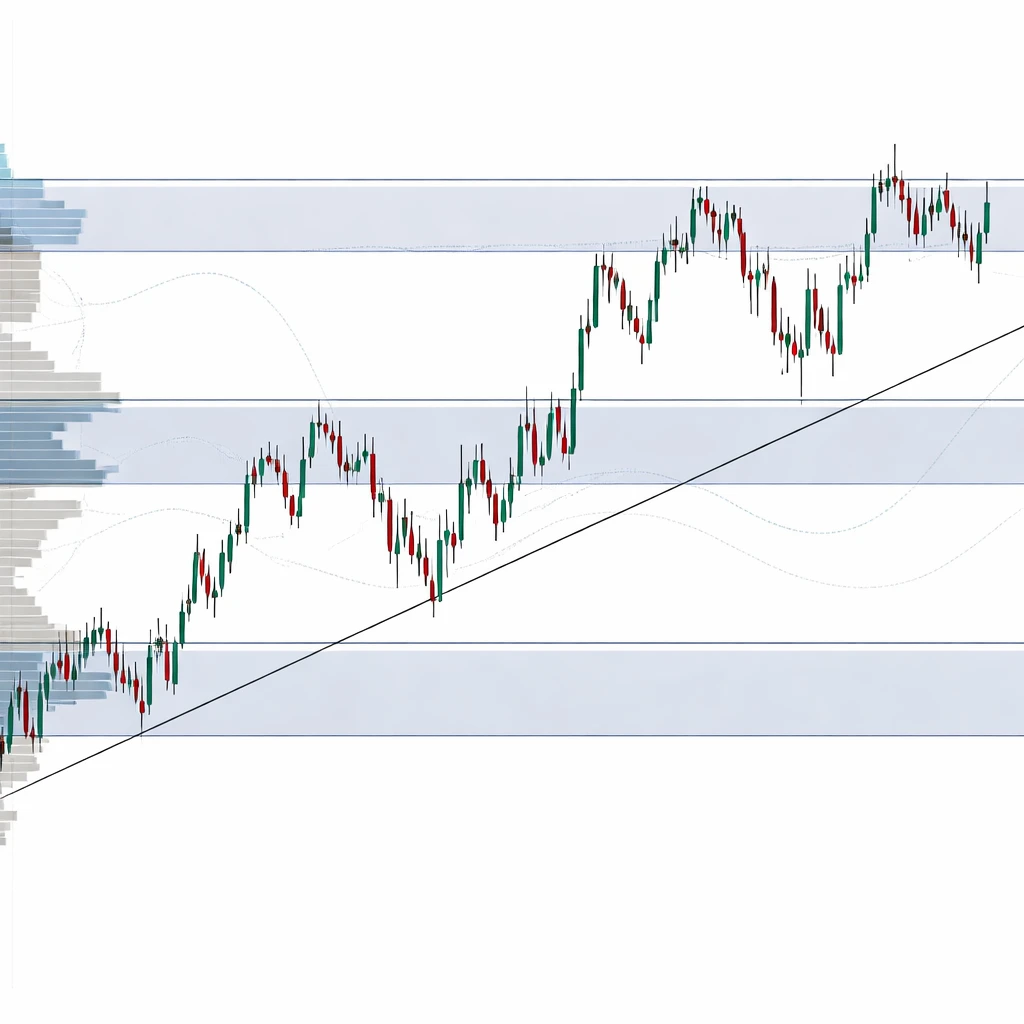
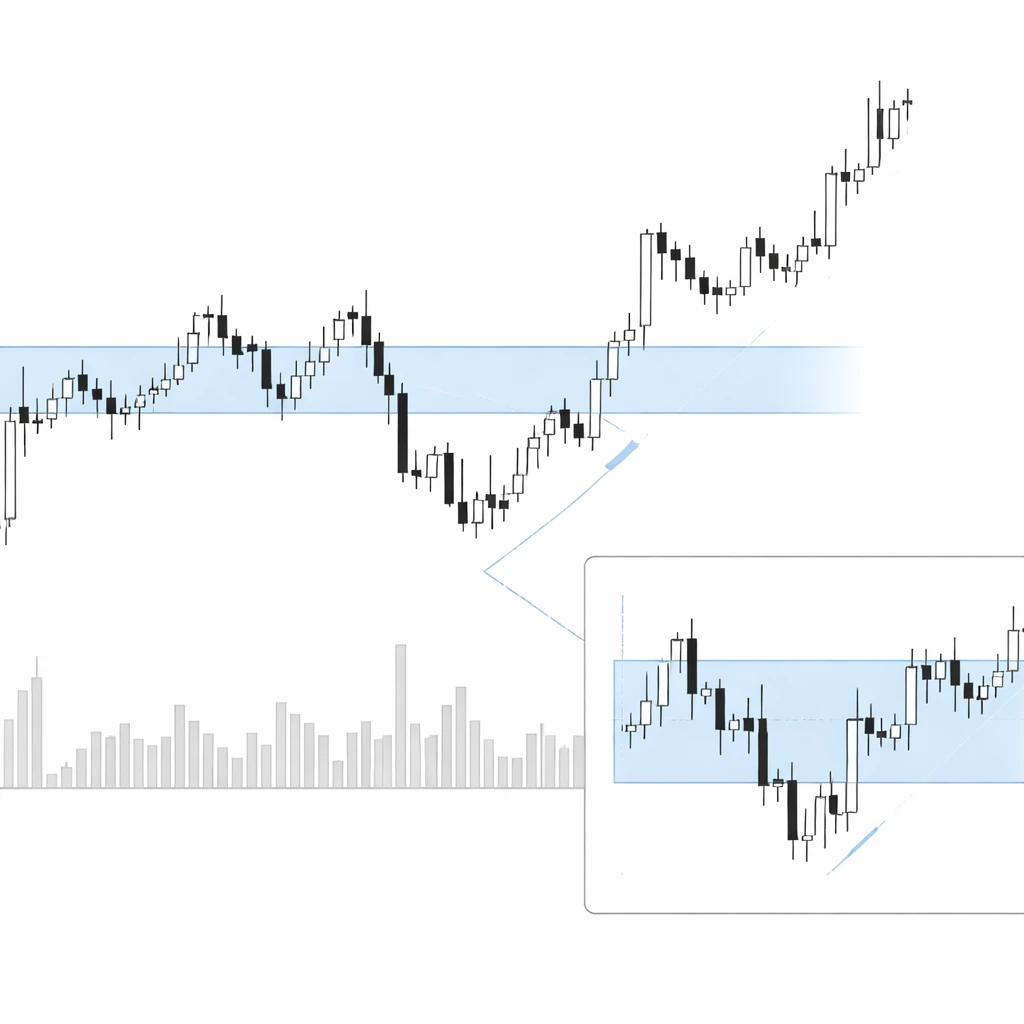
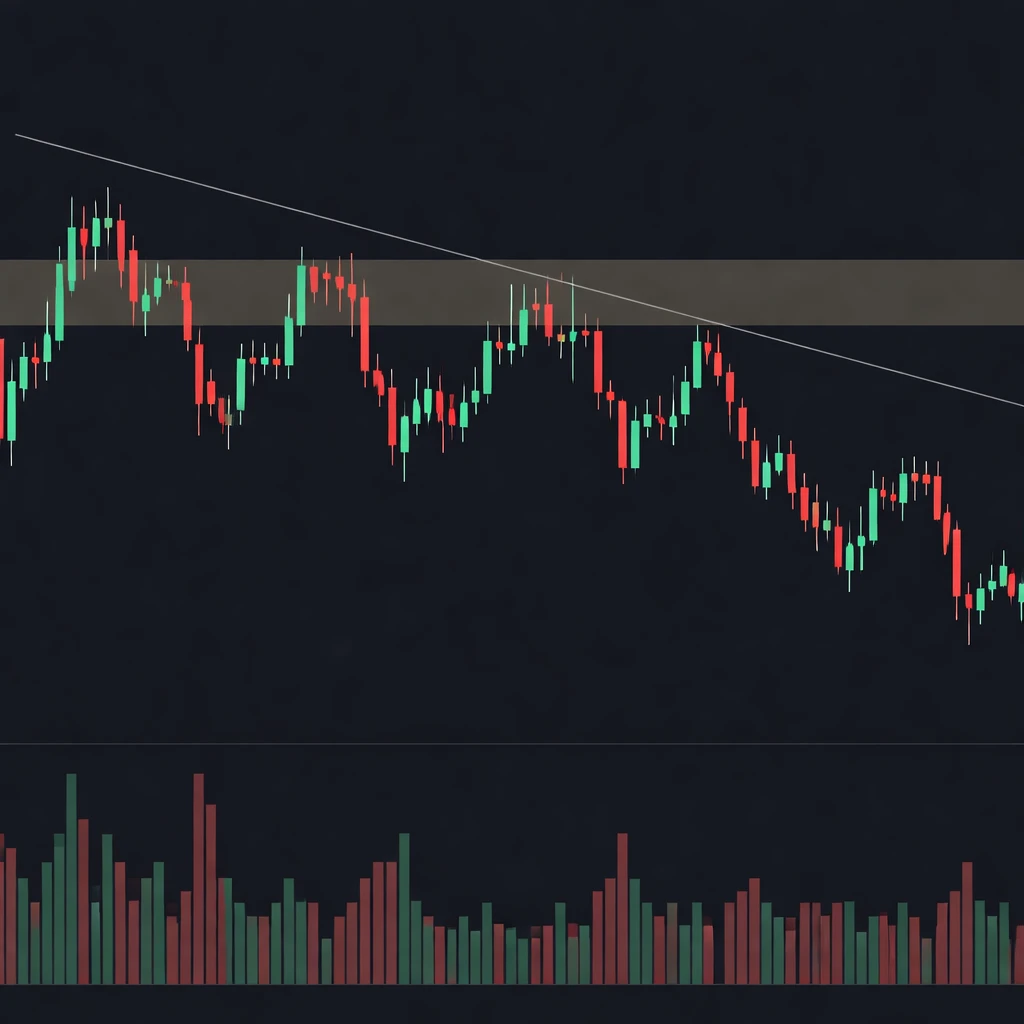
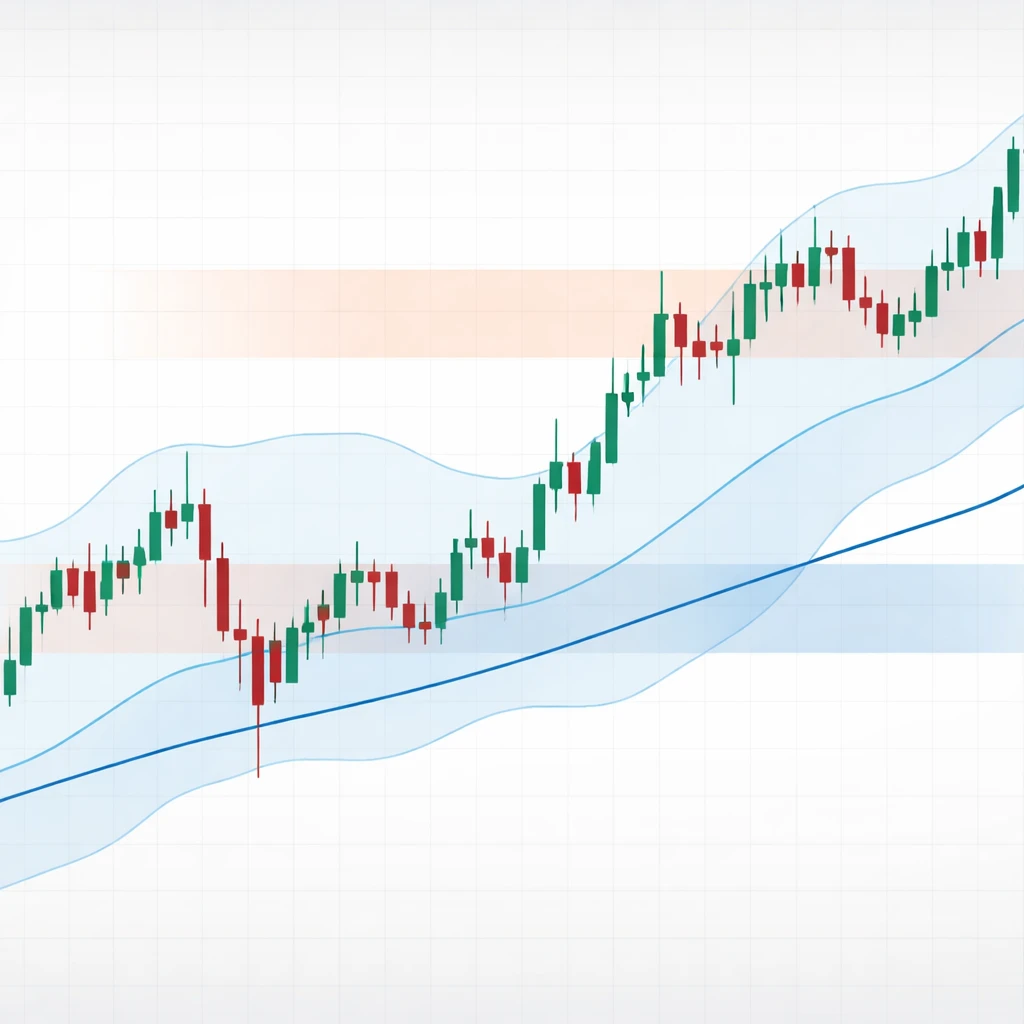
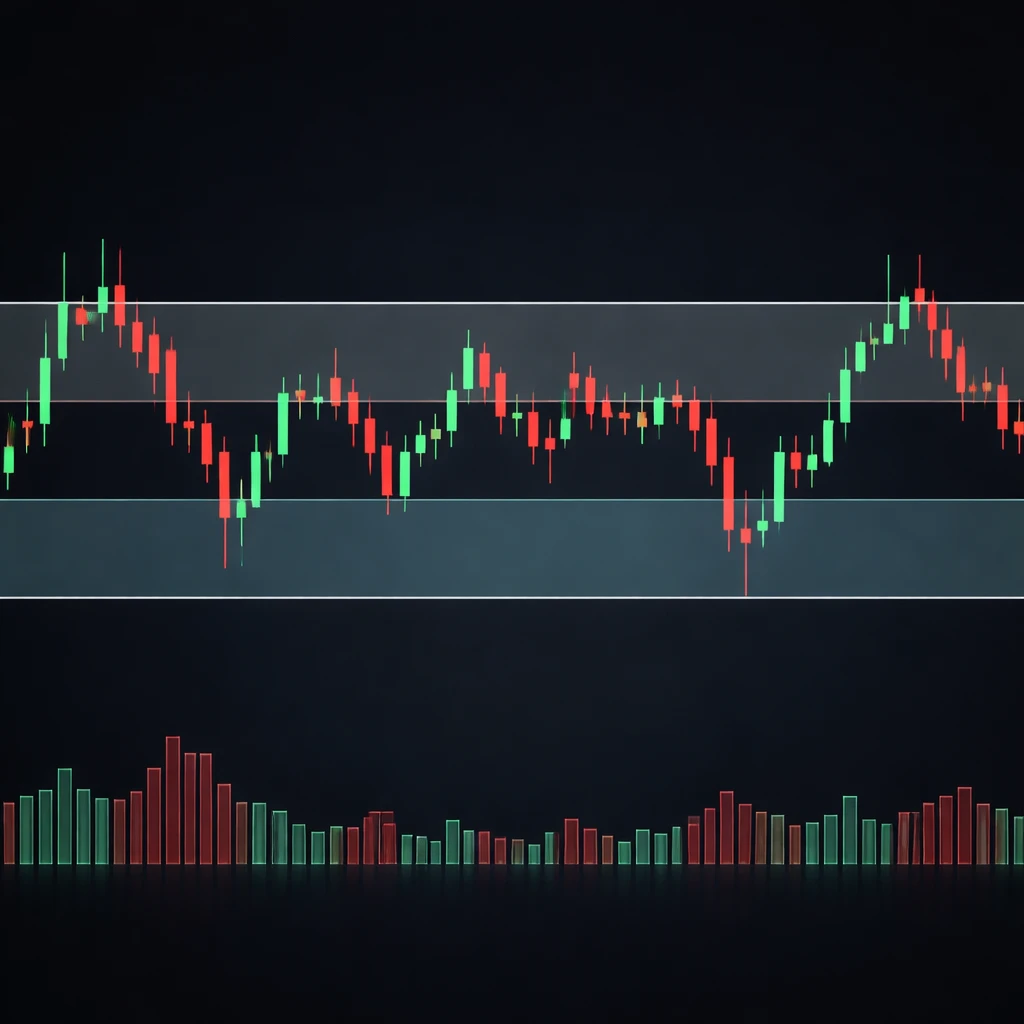
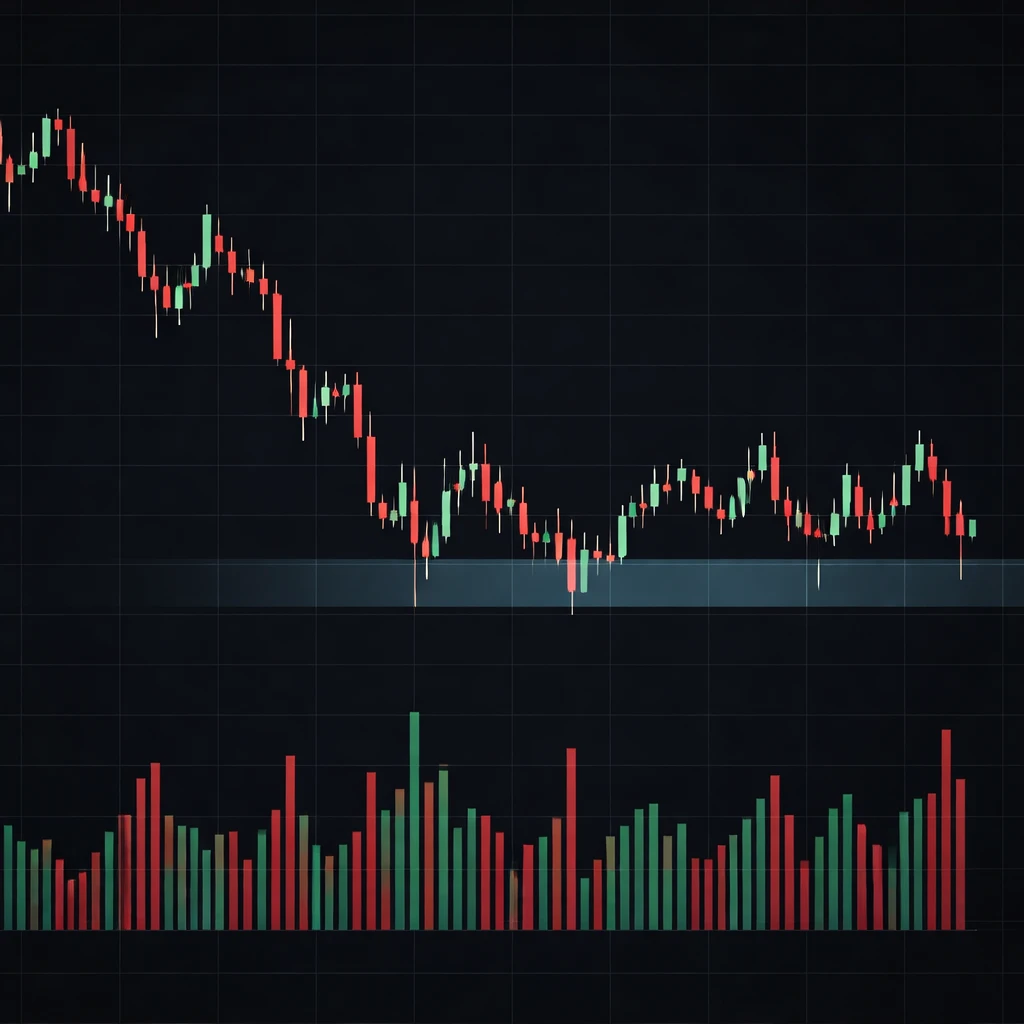
Support is a foundational idea in technical analysis. It refers to a price area where declines tend to slow or halt because buying interest and order flow absorb selling pressure. This article defines support, explains how it appears on charts, and discusses why many traders watch it to interpret market behavior.

10 min read
Intermediate

Why Support and Resistance Form

A rigorous explanation of why support and resistance levels emerge in financial markets, how they appear on charts, and why many market participants monitor them to interpret price behavior and liquidity dynamics. The article integrates microstructure, behavioral, and institutional perspectives with practical chart context.

11 min read
Intermediate

Role Reversal Explained

An in-depth explanation of role reversal in support and resistance. Learn how former resistance can act as support, and former support can act as resistance, why this behavior appears on charts, and how to interpret it without relying on trading strategies.

10 min read
Beginner

What Is Resistance?

An in-depth explanation of resistance in technical analysis, including how it appears on charts, why it attracts attention, and how to interpret it in practical, chart-based contexts without suggesting strategies or recommendations.','content':'Resistance is a foundational concept in technical analysis. It refers to a price area where upward moveme…

10 min read
Intermediate

Dynamic vs Static Levels

An in-depth explanation of dynamic and static support and resistance, how they appear on charts, why they matter for interpreting price behavior, and how to read their interactions across timeframes without proposing trading strategies or recommendations.

13 min read
Intermediate

Psychological Price Levels

An in-depth explanation of psychological price levels in technical analysis, why round numbers attract attention, how they appear on charts, and how to interpret price behavior around them without implying specific trades or recommendations. Illustrated with practical, chart-based context across asset classes.

12 min read
Intermediate

Support and Resistance Zones

Support and resistance zones are areas on a price chart where buying or selling interest clusters, often shaping how price pauses, turns, or accelerates. This article defines these zones, shows how they appear on charts, and explains why many market participants monitor them when interpreting price behavior.

12 min read
Intermediate

False Breaks at Key Levels

An in-depth explanation of false breaks at support and resistance, how they appear on charts, why they matter for interpreting price behavior, and how to recognize their context without prescribing trade actions or setups. Written for intermediate learners in technical analysis.

10 min read
Intermediate

Support and Resistance in Trends

A clear, academically grounded explanation of how support and resistance function within trending markets, how these levels appear on charts, why participants monitor them, and how they help interpret price behavior without prescribing trades or strategies.

10 min read
Intermediate

Support and Resistance in Ranges

A detailed explanation of how support and resistance function inside sideways price ranges, how these zones appear on charts, and why market participants watch them to interpret acceptance, rejection, and liquidity in price behavior. No strategies or recommendations.