Definition and Scope
Price action refers to the direct observation and interpretation of market prices as they evolve through time. In practice it is the study of the open, high, low, and close of each trading period and the relationships across those periods. Rather than transforming price into a derivative indicator, price action focuses on the structure that is visible on the chart itself. This structure includes swings, trend and range behavior, gaps, momentum bursts, and periods of quiet consolidation.
At its core, price action seeks to answer descriptive questions. How far does price travel between highs and lows within a bar or session. Where does it close relative to the range. Do new highs or lows form with ease or hesitation. Do candles cluster into compact ranges or expand rapidly. These observations do not rely on predictions. They produce a contextual reading of behavior that many practitioners use as a basis for further analysis.
Because the same logic applies to any actively traded instrument, price action can be studied in equities, index futures, foreign exchange, commodities, and cryptocurrencies. The approach is also inherently multi timeframe. The meaning of a one minute surge can differ when viewed against a daily consolidation, and vice versa. The aim is consistent description of what price is doing rather than prescriptive rules about what one should do.
How Price Action Appears on Charts
Charts present price action in visual form. Three common displays are line, bar, and candlestick charts. A line chart connects closing prices across periods, which simplifies the view and can be helpful for long trend sequences. Bar and candlestick charts encode more information. They show the open, high, low, and close of each bar, which allows the viewer to assess intraperiod dynamics such as rejection from extremes or persistent movement into the close.
Anatomy of a Bar or Candle
Each bar or candle summarizes a time interval. The open marks the first traded price, the high and low mark the extremes, and the close marks the final traded price for that interval. In a candlestick, the central body represents the distance between the open and the close. The thin lines above and below the body, sometimes called wicks or shadows, show how far price probed beyond the body before returning.
A long body suggests directional conviction within that period. For example, if the close is much higher than the open and the candle body is large relative to prior candles, the period saw sustained buying pressure. A small body with long wicks signals indecision. Price traveled meaningfully in both directions but closed near its start. Context matters. A small indecisive candle after several strong candles may reflect a pause or absorption of recent movement. The same candle inside a quiet range might simply indicate ordinary rotation.
Swings, Structure, and Market States
Beyond single bars, price action is about sequences. A swing high is a local peak that is followed by a decline, and a swing low is a local trough that is followed by an advance. The succession of swing highs and lows describes the market state. A series of higher highs paired with higher lows is the classical signature of an uptrend. The opposite describes a downtrend. When swing highs and swing lows form around similar price levels, the market is often consolidating in a range.
Impulse and correction is a useful lens. An impulse is a directional move that breaks prior swing points or covers distance quickly. A correction is a movement against that impulse that is typically slower or more overlapping. In a strong uptrend, for instance, upward legs are often longer and faster than the pullbacks. As trend strength wanes, the corrections may grow in size, come more frequently, or start to break prior swing lows. Observing these transitions is central to reading price action.
Ranges and Balance Areas
Markets frequently oscillate within ranges. Ranges are areas where buying interest and selling interest are roughly balanced, so price rotates between a relatively stable high and low. Inside a range, price often slows near the edges, where previous attempts to leave the range were rejected. These edges are reference points. The more times price has responded to a boundary, the more that participants are likely to notice it. That visibility does not guarantee a particular outcome. It increases the informational value of the boundary as a place where order flow may concentrate.
As ranges develop, the internal price action can reveal whether one side is starting to gain advantage. For example, if upward pushes from the range low travel a shorter distance each time, while downward pushes from the range high expand more easily, the balance may be tilting lower. Price action analysis documents these asymmetries without presuming what must happen next.
Gaps and Windows
A gap occurs when the market opens outside the prior bar’s range, or when there is no trading between two prices in a continuous session. Gaps are informative because they immediately reframe context. If a stock closed at 50 and opens at 53, trades have occurred at prices that were not available during the prior session. Some gaps are filled quickly as price revisits the prior range. Others hold and become stepping stones in a trend. The response around the gap edges often reveals whether participants accept the new value area or resist it.
Volatility, Expansion, and Contraction
Volatility shapes how price action is read. Expansion phases feature larger candles and longer ranges within each period. Contraction phases feature narrow ranges and quieter behavior. Both can occur in trends and in ranges. A trend can grind upward with small candles and limited pullbacks, or it can surge in rapid bursts separated by pauses. Contraction near an obvious reference level can lead to a sharp expansion once the market leaves the congested area. Observing the alternation between expansion and contraction helps set realistic expectations for distance and speed, which is a descriptive component of price action.
Timeframes and the Fractal Character of Price
Price action is nested across timeframes. A pullback on a daily chart can be a complete downtrend on a five minute chart. A trading range visible on a weekly chart can contain several daily trends. This fractal character means that any observation requires a declared timeframe. A higher high on a one hour chart does not necessarily contradict a lower high on a daily chart. Both can be true, and the analyst’s job is to keep the frame of reference explicit.
Many practitioners examine at least two frames together. The higher timeframe supplies structural context such as whether the broader market has been trending or consolidating. The lower timeframe supplies detail about how price traverses the higher timeframe’s regions. When the two frames align, price action appears coherent. When they conflict, ambiguity rises and the reading becomes more cautious. The observations remain descriptive. The goal is consistency in how the market state is labeled as one moves between frames.
Why Traders Study Price Action
There are several reasons why price action attracts attention across market participants.
- Immediacy: Price is the first available data. Indicators that transform price can be useful, yet they necessarily introduce smoothing or lag. Price action is read straight from the tape of completed transactions, which makes it timely for interpretation.
- Universality: The same descriptive framework applies to different instruments and time horizons. Swings, trends, ranges, gaps, and volatility regimes are present in most liquid markets.
- Behavioral content: Prices encode the interaction of diverse motives. Traders respond to previous highs and lows, round numbers, and gaps because those points are visible to others. This visibility can attract orders and create feedback loops that are evident in the chart’s structure.
- Risk context: Without specifying strategies, price action can still help frame where volatility has clustered and where it has been absent. Knowing whether current movement is expanding or contracting can inform expectations about variability.
- Transparency of narrative: Price action allows analysts to tell a coherent, data grounded story of how the market moved from one region to another. That narrative can be checked objectively against the chart.
Practical Chart-Based Context
The following examples present neutral descriptions of chart behavior. They are not strategies or recommendations. They illustrate how price action can be read to understand market context.
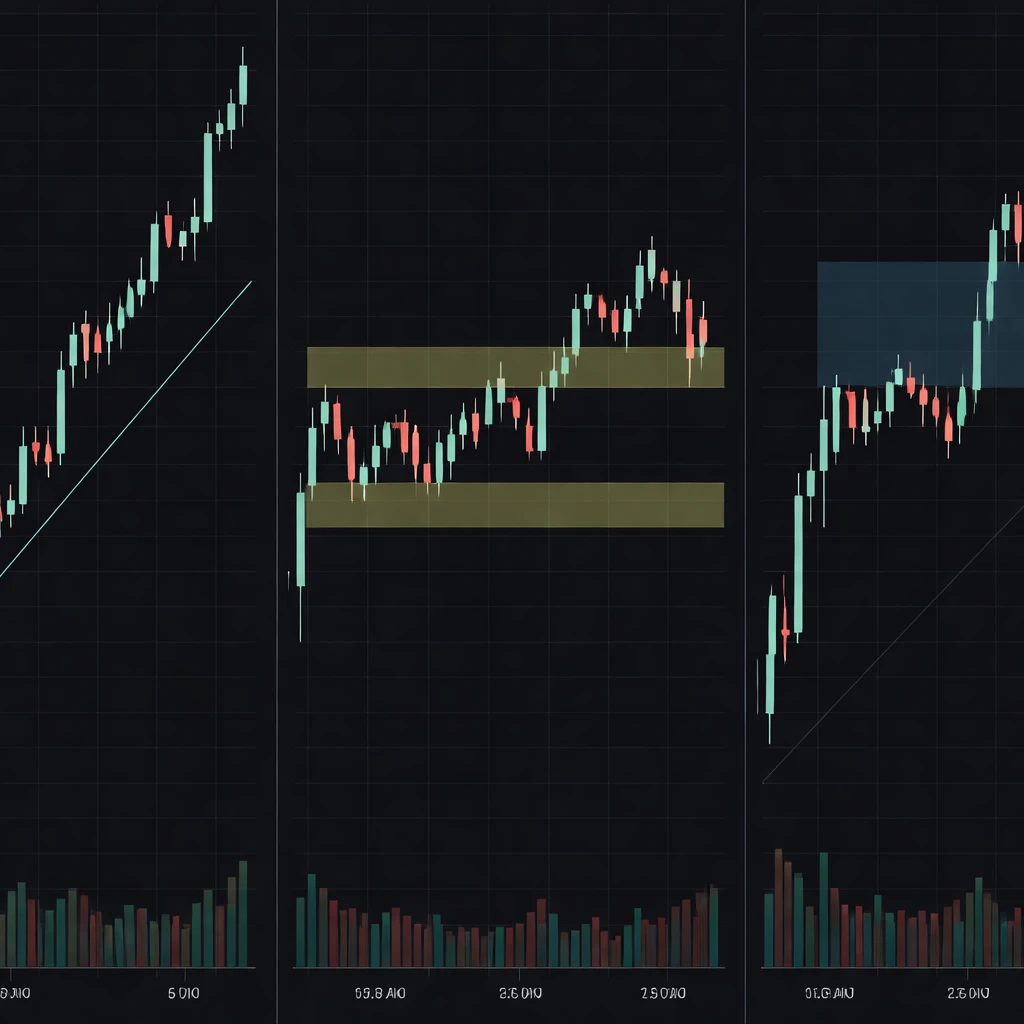
Example 1: Daily Uptrend With a Transition
Imagine a daily candlestick chart of a large index. Over several weeks, the index makes a sequence of higher highs and higher lows. The upward legs feature relatively large bodied candles that close near their highs. Pullbacks are shorter in distance and often contain candles with longer lower wicks that indicate intraday probing followed by recovery into the close. This combination suggests persistent demand and limited willingness to sell at lower prices within that period.
As the advance progresses, the higher highs shrink in size. New highs are achieved by small margins, and several candles near those highs close with upper wicks. The appearance of upper wicks does not, by itself, imply a reversal. It shows that price explored higher levels during the day and encountered responsive selling that pushed it back toward the open or the midpoint of the range. If this behavior repeats over multiple sessions and the pullbacks deepen enough to break a prior swing low, the structure shifts from a pure uptrend toward either a range or a developing downtrend. The reading is sequential. First the higher highs lose momentum. Next the pullbacks expand. Finally an important swing level gives way. Each step is visible in price action without reference to any external signal.
Example 2: Intraday Range and Breakout Attempt
Consider a liquid futures contract on a five minute chart. The session opens slightly above the previous close, rallies for twenty minutes, then stalls. For the next two hours, price oscillates within a clearly defined band. The candles inside the band are compact and close near their midpoints. That is typical of balance. Near the upper boundary of the band, several candles show small bodies and slightly longer upper wicks. The market is testing for acceptance above the boundary but cannot sustain trade there. Eventually one candle closes just above the band on a noticeable increase in range compared to the prior bars. The next candle returns to the interior of the band and closes back inside.
In descriptive terms, the market attempted to leave the balance area and was rejected. The wicks at the highs indicated earlier hesitation. The temporary push beyond the boundary and the immediate return provide further evidence that supply was stronger than demand at that location during those minutes. Whether the market later resolves higher or lower is a separate question. The price action reading focuses on what just occurred and how it alters the developing picture of balance and imbalance.
Example 3: Gap Context on a Stock
Suppose an earnings release leads to a significant gap up on the daily chart of a stock. The open occurs well above the prior day’s high, and the first hour of trading ranges within a tight span near the open. From a price action perspective, two reference areas are noteworthy. The top of the gap, where the session opened, and the prior session’s high, which marks the nearest visible level from which the gap separated. If price drifts downward intraday and pauses near the prior session’s high, observers can see whether buyers are active at that level. If price rebounds and closes near the session high, the day’s price action suggests that the market accepted higher value without significant challenge. If price continues lower and closes the gap, the chart documents a failure to sustain the gap zone. Both outcomes are common and neither alone predicts a multi day path. The descriptive value lies in how price interacts with the gap edges.
Price Action Compared With Indicator-Based Views
Indicators are mathematical transformations of price and sometimes volume. A moving average smooths the series to highlight trend. An oscillator scales price changes to show where recent moves are extreme relative to a chosen window. These can be helpful for structure and confirmation. They also abstract away from the raw sequence of highs and lows. Price action begins from the untransformed series and builds interpretation using the direct geometry of movement on the chart.
The two perspectives are not mutually exclusive. Many analysts start with price action to define market state, then consult an overlay or an oscillator to cross check what they see. For instance, a trend identified by higher highs and higher lows on the chart may also appear as price holding above a long moving average. The important point is conceptual. Price produces indicators, not the other way around. Price action reading focuses attention on what the market actually did, which can sharpen how additional tools are applied.
Limitations, Ambiguity, and Common Pitfalls
Price action is powerful as a descriptive framework, but it has limitations that deserve explicit recognition.
- Ambiguity across frames: A market can be trending on one timeframe and ranging on another. Without a declared frame, interpretations can be inconsistent.
- Noise and over-interpretation: Short windows can contain a large amount of randomness. Isolating meaning from minimal movement often leads to narrative creation that is not supported by sufficient evidence.
- Selection bias: Chart readers sometimes recall patterns that worked and forget those that did not. Without rigorous logging, impressions about reliability can be misleading.
- Nonstationarity: Market behavior changes. A structure that appears frequently during one regime can become rare in another. This affects any inference drawn from historical examples.
- Liquidity and microstructure effects: Thinly traded instruments can show erratic tails or irregular gaps that do not carry the same meaning as similar shapes in deep markets. Session boundaries and opening auctions also influence early bars in ways that should be accounted for.
Working With Price Action in Practice
A methodical approach to price action centers on clear definitions and consistent observation. Define what constitutes a swing high or swing low on a given timeframe. Specify how many bars are required to confirm a swing. Identify what qualifies as a range boundary and how much breach is required before a move is considered outside the range. Decide how to classify impulse and correction, and whether that classification depends on relative bar size, speed, or both.
Timing and distance are two descriptive dimensions worth tracking. Timing refers to how long a move takes. Distance refers to how far it travels in price terms. An uptrend composed of swift advances and slow pullbacks is different from one composed of slow advances and equally slow pullbacks. A range where rotations are symmetric is different from one where upward rotations cover less ground than downward ones. Logging these features helps maintain an objective record of market state.
Another practical element is the annotation of reference points. Prior highs and lows, gap edges, session opens and closes, and clearly defined range boundaries are common anchors. Price action around these anchors provides information about acceptance or rejection of value. Whether such levels hold or fail is less meaningful than how price behaves as it approaches them. Quick rejection suggests eager opposing interest. Slow drift through suggests that previous participants are not defending the level.
Charting and Data Considerations
The clarity of price action depends on the clarity of the underlying data and display choices. Several considerations matter in routine chart work.
- Choice of chart type: Candlestick and bar charts provide intraperiod information that line charts omit. Candlesticks are popular because they separate body and wick visually, which supports quick reading of rejection and follow-through. Bar charts communicate the same information without filled bodies.
- Session definitions: Intraday charts can be built on regular trading hours or on a 24 hour basis for futures and some currencies. The choice changes the location of highs and lows and can create or eliminate gaps.
- Adjustments for corporate actions: Equity charts are commonly adjusted for splits and dividends on daily and higher frames. Unadjusted charts preserve raw prints but introduce artificial gaps at split dates. Price action readings should account for how the data are adjusted.
- Price scale: Logarithmic scaling represents equal percentage moves as equal vertical distances. Linear scaling represents equal absolute moves as equal distances. Over long horizons, log scaling often provides a more accurate sense of proportional change.
- Data quality: Bad ticks and missing bars distort price action, particularly on fast timeframes. Verifying data integrity avoids misinterpretation of spurious spikes or gaps.
Conceptual Foundations
Price action has ties to microstructure and behavioral finance. Limit orders rest at visible prices and accumulate near salient references such as prior highs, lows, and round numbers. Market orders meet that resting liquidity and reveal whether the resting interest is sufficient to hold the level. When price moves quickly through a region, it often indicates thin liquidity or strong market orders that sweep the book. When price repeatedly wicks into an area and retreats, it suggests responsive activity that absorbs attempts to move beyond that area. These inferences are probabilistic and context dependent, yet they give price action its explanatory power as a record of interaction between supply and demand.
Extending the Reading Without Strategy Prescription
Although many traders build explicit rules around price action, one can benefit from a purely descriptive practice. That practice might include mapping trend versus range conditions, noting the locations of obvious reference points, and classifying sessions by expansion or contraction. It might also include counting the number of consecutive closes in one direction, the average size of impulses relative to corrections, or the proportion of bars that close near their highs or lows. These statistics turn qualitative impressions into measurable summaries without dictating specific trading decisions.
The objective is consistency. If a market is labeled as trending on Monday, the same criteria should produce the same label on Wednesday when a similar configuration appears. Consistency allows for comparison across periods and instruments. It also makes it easier to evaluate whether particular price action environments coincide with outcomes that meet a given analytical or risk management standard.
Putting the Concept in Perspective
Price action is the first language of the chart. It reduces market behavior to its essentials and gives analysts a structured way to answer what is happening. That answer may be simple. The market is advancing with larger up bars and shallow pullbacks. It may be subtle. The market is inside a weekly range and is compressing near the top of that range on declining intraday ranges. Both answers are valid as long as they adhere to a consistent method of reading the tape. Price action does not promise certainty. It delivers a disciplined description of behavior that can anchor further analysis or risk framing.
Key Takeaways
- Price action is the direct study of the open, high, low, and close across time, focusing on swings, structure, momentum, and volatility without relying on transformed indicators.
- On charts, price action appears through candle and bar anatomy, sequences of higher highs and lows or range rotations, gap behavior, and the alternation between expansion and contraction.
- Analysts pay attention to price action because it is immediate, universal across markets and timeframes, and rich in behavioral information tied to visible reference points.
- Practical reading involves consistent identification of market states, reference levels, and the relationship between impulses and corrections, supported by clear data and charting choices.
- Price action is descriptive rather than predictive, and it carries limitations related to ambiguity, noise, nonstationarity, and liquidity that should be acknowledged.