Overview
Inside bars are a compact way to read short-term balance in price action. They are among the simplest structural patterns because they rely only on two consecutive candles: a larger reference candle and a smaller candle fully contained within it. Although the construction is simple, the information content can be meaningful when considered within broader context such as trend strength, volatility regime, and location relative to recent highs and lows. This article defines inside bars precisely, shows how they appear on charts, explains why market participants pay attention to them, and develops practical, chart-based examples that emphasize interpretation rather than prescription.
Definition and Basic Properties
What is an inside bar
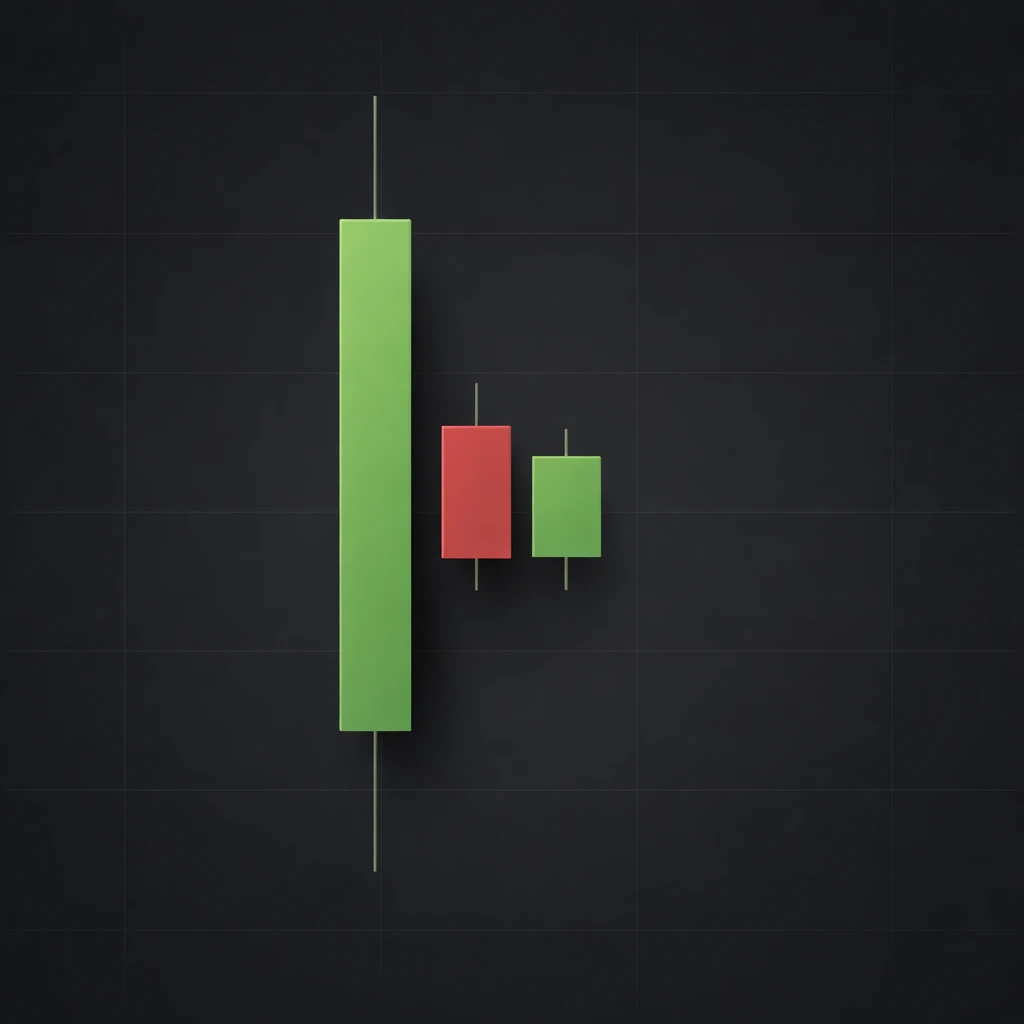
An inside bar is a candle whose high and low are both within the range of the immediately preceding candle, often called the mother bar. Formally, if the previous candle has high H0 and low L0, and the current candle has high H1 and low L1, then the current candle is an inside bar when L0 ≤ L1 and H1 ≤ H0. The open and close of the inside bar do not affect the classification. The candle’s color, body length, and the presence of wicks are also irrelevant to the definition as long as the full high–low range is contained within the prior range.
Strict versus inclusive definitions
Some charting tools or practitioners require strict containment, meaning L0 < L1 and H1 < H0. Others allow equality at one or both bounds. Equality decisions can matter on markets where prices cluster at ticks. When comparing analyses, it is helpful to state whether equal highs or equal lows are considered inside. The difference is minor in many contexts, but consistency prevents confusion when counting occurrences or back-checking historical charts.
Appearance on common chart types
On a candlestick chart, the mother bar usually looks relatively tall or at least broader than the bars that follow. The inside bar looks visually smaller, with its top and bottom swallowed inside the mother bar’s range. On an OHLC bar chart, the same containment rule applies to the vertical extremes of the bars. Line charts, which connect closes, cannot display inside bars because they do not show highs and lows. Inside bars can occur on any timeframe, including intraday minutes, daily, weekly, and monthly charts. The label inside day is simply the daily-chart version of the same structure.
Multiple inside bars
It is common to observe a sequence of two or more inside bars after a large mother bar. In this case, each subsequent bar is contained within the range of the original mother bar. This stacking often forms a visible consolidation box on the chart and represents a prolonged contraction in the realized trading range. Some analysts refer to this as an inside bar cluster. The interpretation still depends on context, as discussed later.
Why Market Participants Pay Attention
Range contraction and information compression
Inside bars reflect a contraction in the traded range. In probabilistic terms, the distribution of prices during the inside bar is tighter than during the mother bar. Observers view this as information compression. The market is temporarily balanced relative to the prior period’s imbalance. Compression is not inherently bullish or bearish. It signals that, relative to the previous candle, either new information was limited or participants hesitated to test prior extremes.
Microstructure perspective
In liquid markets, a wide mother bar often indicates aggressive initiative activity on one or both sides. When an inside bar follows, it can imply that market orders slowed and that liquidity clustered within a narrower band. Limit orders may accumulate near the edges of the mother bar, while initiatives retreat toward neutrality. This interpretation does not predict direction. It indicates a pause in directional urgency.
Volatility regimes
Inside bars occur more frequently during low-volatility regimes and during intraday lulls, such as midday trading in equity indices. They are rarer during momentum bursts or around news releases. A switch from a series of wide-ranging candles to a contraction phase is an ordinary component of volatility cycling. Many analysts track contractions because markets often alternate between periods of expansion and contraction. The timing and direction of any subsequent expansion are separate questions that require additional context.
Event-related uncertainty
Ahead of scheduled announcements, some markets tend to compress as participants reduce exposure to prior extremes. Inside bars can appear during these waiting periods. After the event, ranges often expand. The presence of an inside bar around an event window should be interpreted with this background in mind. It can reflect collective caution rather than a directional cue.
Contextual Interpretation
Location relative to recent structure
Where an inside bar forms matters. Inside bars near swing highs or swing lows may reflect hesitancy to break a boundary that many participants observe. Inside bars in the middle of a trading range often represent routine indecision. Near well-observed levels such as prior day highs and lows on intraday charts or prior month extremes on higher timeframes, the pattern can mark temporary equilibrium as participants assess whether available liquidity is sufficient to challenge those levels.
Size of the mother bar
The informational value of an inside bar is linked to the size of its mother bar. When the mother bar is unusually large for the timeframe and instrument, the inside bar often looks particularly small, making the contraction more obvious. When the mother bar is already quiet, an inside bar that is only marginally smaller may not stand out. Analysts sometimes normalize range measurements by average true range to account for changing volatility, which helps distinguish meaningful contraction from ordinary noise.
Frequency and clustering
One isolated inside bar can be incidental. A cluster of inside bars is a stronger signal of prolonged equilibrium. Again, this is not directional. It speaks to the degree of compression. Buyers and sellers are repeatedly finding prices acceptable within the same boundaries, and neither side is pressing the market to inspect the prior extremes. Clustering can also arise from market microstructure, such as reduced participation during holidays or when liquidity providers widen spreads without inviting tests of the outer range.
Trend versus range background
Inside bars within a well-established trend may indicate a pause within that background condition. Inside bars inside a broad range may reflect internal sub-ranges. The same printed pattern can therefore carry different connotations depending on higher timeframe context. Analysts often compare the inside bar regime with what preceded it, asking whether the contraction interrupts dominance by one side or simply continues a broader balance.
Variations and Related Concepts
Inside day and inside week
The labels inside day and inside week apply the same containment rule to daily and weekly candles. An inside day on a daily chart may occur even if multiple intraday candles broke the prior day’s extremes because the classification only references daily highs and lows. Conversely, an intraday inside bar might not translate into an inside day if, during the remainder of the session, the day’s high or low exceeds the prior day’s range. Analysts should be explicit about the timeframe in use to avoid conflating intraday containment with daily containment.
Harami in candlestick literature
The harami pattern in traditional candlestick literature resembles an inside bar, especially the two-candle variant where the second candle’s body is contained within the previous candle’s body. The key distinction is that the harami focuses on body containment and color, while the inside bar uses full-range containment. As a result, a candle can be an inside bar but not a harami, or vice versa, depending on wicks and bodies.
Narrow-range measures
Quantitative measures such as NR4 or NR7 label a candle as unusually narrow relative to the past n candles. An inside bar is not required for an NR designation, and not all inside bars are among the narrowest in a given window. Inside bars prioritize containment relative to the immediately preceding candle, while narrow-range metrics compare absolute size across a fixed lookback window. The two approaches can complement each other for descriptive purposes.
Inside bars after gaps
Gaps can complicate interpretation. A large gap may produce a mother bar with an outsized range relative to intraday trading, followed by one or more compressed candles. Inside bars that occur after a gap may reflect the market digesting new information that has already been priced in by the gap. The body of the inside bar may be small, with wicks testing local liquidity, while still remaining within the gap day’s range.
Measuring Inside Bars
Range ratios
To quantify an inside bar’s contraction, some analysts compute the ratio of the inside bar’s range to the mother bar’s range. For example, if the mother bar’s range is 2.4 units and the inside bar’s range is 1.2 units, the ratio is 0.5. Ratios closer to zero indicate stronger contraction. While no threshold is canonical, documenting range ratios can aid historical comparison across instruments and volatility regimes.
Normalized ranges
Because volatility fluctuates, range measurements benefit from normalization. One approach is to scale ranges by average true range over a chosen window. A mother bar that is 1.8 times the recent average followed by an inside bar at 0.6 times the recent average communicates stronger compression than raw values might suggest. Normalization makes it easier to compare across different assets whose tick sizes and typical ranges differ materially.
Counting clusters
For sequences of inside bars, one can record the number of consecutive inside bars relative to a single mother bar. A two-bar cluster means two inside bars after the mother bar. A three-bar cluster means three. The count can be extended as long as the range condition remains satisfied. Clustering is a descriptive statistic that helps identify extended consolidations for further study.
How Inside Bars Appear in Practice
Illustrative daily chart scenario
Consider a liquid equity index on a daily chart. After a multi-week rise, the index prints a tall daily candle with a relatively long upper wick, followed by a smaller candle whose entire range sits within the prior day’s high and low. The next day produces another contained candle. Visually, the two inside days form a distinct box inside the tall mother bar. This sequence communicates that, after notable directional travel, activity paused and compressed. Participants hesitated near the recent highs, and the market tested neither the mother bar’s high nor its low during the two days of consolidation.
Different outcomes can follow. In some instances, the market later moves beyond the mother bar’s range as new orders arrive. In other instances, additional inside days accrue, and the consolidation persists. Less frequently, the market oscillates within the mother bar’s range for some time without clear directional follow-through. The inside bar structure does not tell which path will occur. It communicates the current state of balance and contraction relative to the prior day.
Intraday example around a scheduled event
Imagine a currency pair on a 15-minute chart during the hours preceding a central bank announcement. The morning session shows moderate swings. As the event approaches, a larger 15-minute candle appears, followed by two 15-minute inside bars with small bodies and modest wicks. The pattern indicates that price is trading in a restricted band. Liquidity providers may tighten quotes inside the mother bar as directional participants wait for the announcement. After the release, ranges typically expand, but the inside bar sequence itself only indicates that pre-event trading compressed.
Rotational market example
In a sideways commodity market, daily charts sometimes alternate between modest up and down days within a wider horizontal band. Inside days in this context often appear after an average-sized day as part of routine back-and-fill. The inside bar simply reflects a day of reduced initiative, often occurring when the market drifts between more actively defended range edges. The message again is balance rather than direction.
Reading Inside Bars Without Overreach
A descriptive, not predictive, element
An inside bar is best handled as a descriptive element. It tells that the market did not explore beyond the prior range during that period. The description can be valuable when piecing together a narrative of auction behavior, volatility cycling, and market participation. However, it does not, by itself, specify what should happen next or provide probabilistic edges without additional structure and testing.
Compatibility with price-only analysis
Inside bars fit fully within a price action framework that relies only on highs, lows, opens, and closes. They do not require any indicators. Analysts who prefer to avoid derived measures can still use inside bars to understand when the market is compressing or pausing. Others may combine the concept with volatility measures or volume to add nuance. Either approach begins with the basic containment rule.
Interpreting wicks and bodies
While wick length and body size do not affect the inside bar classification, they can enrich interpretation. For example, a small inside bar with relatively long wicks at both ends suggests probing within a narrow band that still encountered responsive interest near the intrabar extremes. A small body with minimal wicks suggests trading stayed concentrated near the open and close. These are subtle variations that can differentiate one inside bar from another without changing the structural definition.
Common Pitfalls and Limitations
Timeframe dependence
Inside bars depend on the chosen timeframe. A 5-minute inside bar can occur within a 60-minute candle that is not inside. Conversely, a daily inside day can occur even if multiple intraday breaks of the prior day’s extremes happened and reversed. When comparing analyses, it is important to specify the timeframe and avoid transferring interpretations from one timeframe to another without justification.
Data and charting differences
Data feeds vary in how they handle session boundaries, pre-market or after-hours trading, and price rounding. An inside bar on one platform may not appear the same on another if one includes extended trading hours and the other does not. The question of whether equal highs or lows count adds another source of discrepancy. For rigorous study, keep definitions and data scope consistent, especially when counting occurrences across a historical sample.
Event risk and false inference
Inside bars ahead of scheduled events can be common, as participants compress risk and await new information. Treating these as informative about future direction can conflate equilibrium with prediction. Similarly, inside bars that form during low-liquidity periods, such as holiday sessions, may be driven more by participation constraints than by evolving conviction.
Overemphasis on isolated occurrences
It is easy to overemphasize a single inside bar and ignore the broader environment. The usefulness of any one observation increases when read in conjunction with preceding and surrounding structure, including the relative size of recent candles, the position within observable ranges, and evidence of acceptance or rejection at nearby reference levels.
Identification Across Instruments and Sessions
Equities, futures, and FX
Inside bars appear across asset classes, though frequency and character differ. Highly liquid futures often show clean inside bars on intraday charts during midday periods. Equity indices on daily charts may display clusters after large moves or gap days. Currency pairs frequently compress ahead of macroeconomic releases and during session overlaps when liquidity is abundant but directional conviction is limited.
Session settings and extended hours
For instruments with extended sessions, the definition of the prior candle depends on the session filter in the chart. If a daily candle includes pre-market trades, the prior day’s range might be wider than a regular-session-only chart. Consequently, the presence or absence of an inside day can change. Analysts should decide which session definition is appropriate for their purpose and apply it consistently.
Multiple Timeframe Reading
Inside bars lend themselves to a top-down reading. A weekly inside bar can encapsulate a multi-day standoff within a broader trend or range. Within that weekly structure, a daily chart may show alternating pushes that do not exceed the weekly mother bar’s extremes. Recognizing these nested relationships can help explain why price appears stagnant on one timeframe while active on another. The nested view still relies on the same containment rule at each timeframe.
Frequently Asked Conceptual Questions
Do candle colors matter for classification
No. Candle colors reflect open-to-close direction and are not part of the inside bar definition. An inside bar can be up, down, or neutral, and it remains an inside bar as long as its high and low are within the prior candle’s range.
Do wicks count
Yes. The high and low include wicks. Body-only comparisons are features of other candlestick patterns, not of inside bars.
What if the mother bar is unusually small
An inside bar after a very small mother bar may be less informative because the containment happens within a tight band that was already contracted. Whether this is meaningful depends on broader context and the volatility regime. Normalizing by recent average ranges can help assess whether the contraction is notable.
Is a large number of inside bars unusual
Long sequences of inside bars do occur, particularly during prolonged consolidations or low-participation periods. The information content of a long cluster is chiefly that the market stayed balanced within the same outer bounds for an extended time.
How does volume relate to inside bars
Volume is not part of the definition, but it can color interpretation. Some inside bars print on lower volume during lulls. Others print on higher volume when active two-way trade occurs inside a balance area. The same containment can therefore reflect different participation patterns, which is why context is important.
Practical Notes for Chart Reading
Marking mother bar boundaries
To read inside bars effectively, it is helpful to mark the high and low of the mother bar so that subsequent containment is obvious at a glance. As additional candles print, those boundaries serve as short-term references for whether the market is inspecting prior extremes or continuing to accept prices within the established band.
Comparing to recent history
Comparative assessment adds perspective. Ask whether the mother bar was large or small relative to the preceding cluster of candles. Note whether the inside bar cluster forms near a prominent level visible on the higher timeframe. These simple comparisons reduce the risk of misclassifying ordinary noise as meaningful compression.
Documenting definitions
When sharing charts or conducting historical counts, record the rules used. State whether equality counts, which session hours were included, and which timeframe was analyzed. Documenting definitions helps others reproduce observations and keeps interpretations grounded.
Putting It All Together
Inside bars are a compact concept with a clear definition grounded in the price extremes of consecutive candles. Their significance lies in what they say about the immediate balance of buying and selling and about the current state of volatility relative to the preceding candle. They appear across timeframes and instruments, often clustering during consolidations, ahead of events, and during low-participation periods. They are descriptive elements that gain value when situated within broader market structure.
Key Takeaways
- An inside bar is a candle whose high and low are fully contained within the prior candle’s range, regardless of color or body size.
- Inside bars indicate range contraction and short-term balance relative to the mother bar, not a directional forecast.
- Context matters: location within recent structure, the size of the mother bar, and clustering all shape interpretation.
- Definitions differ on whether equal highs or lows count, and data or session settings can alter whether a bar qualifies.
- Inside bars are descriptive building blocks useful for reading volatility cycles and market balance across timeframes.