Price Action

Analyzing market behavior using raw price movement without heavy reliance on indicators.

Part of Technical Analysis

What you will learn

This scope is designed to help you build a practical understanding of Price Action. Lessons move from core definitions to real-world context and common failure points.

Lessons

Reading in order is recommended, but each lesson stands on its own.

12 min read
Beginner

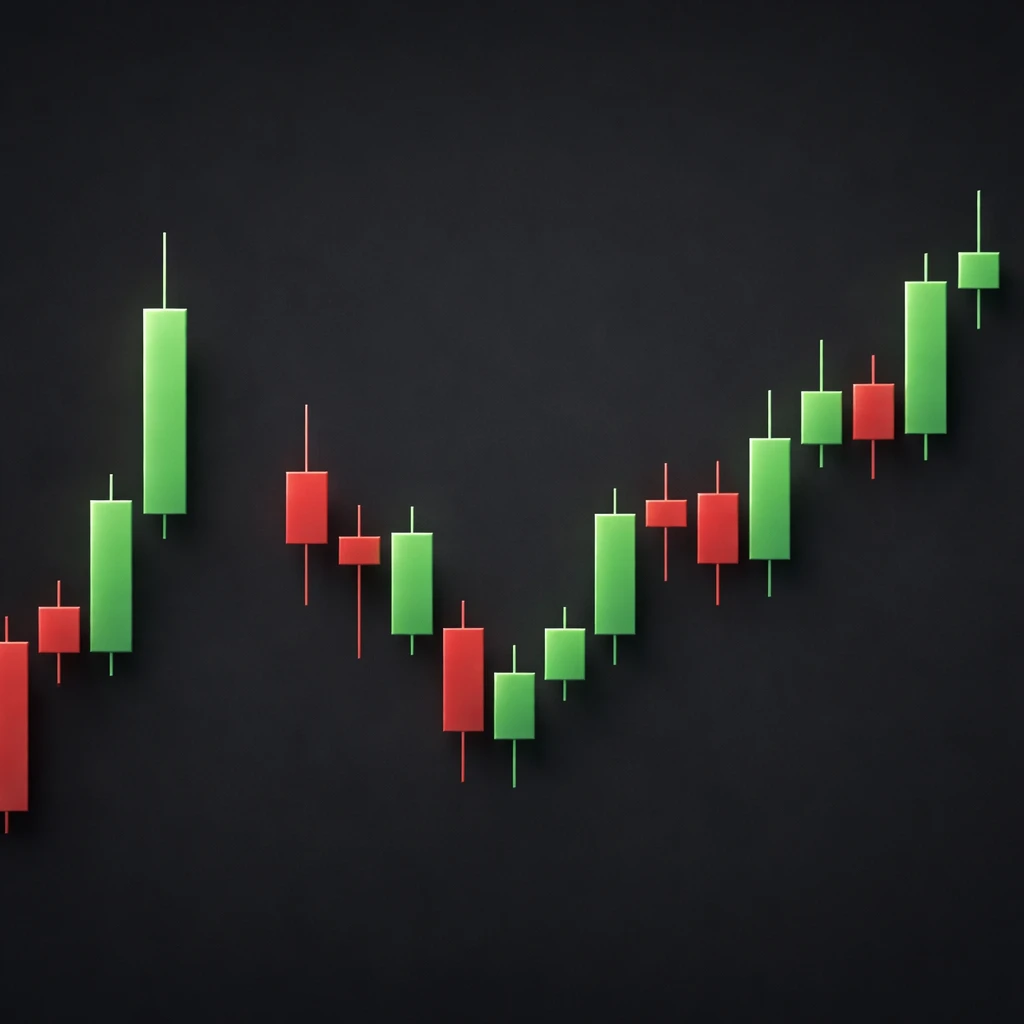
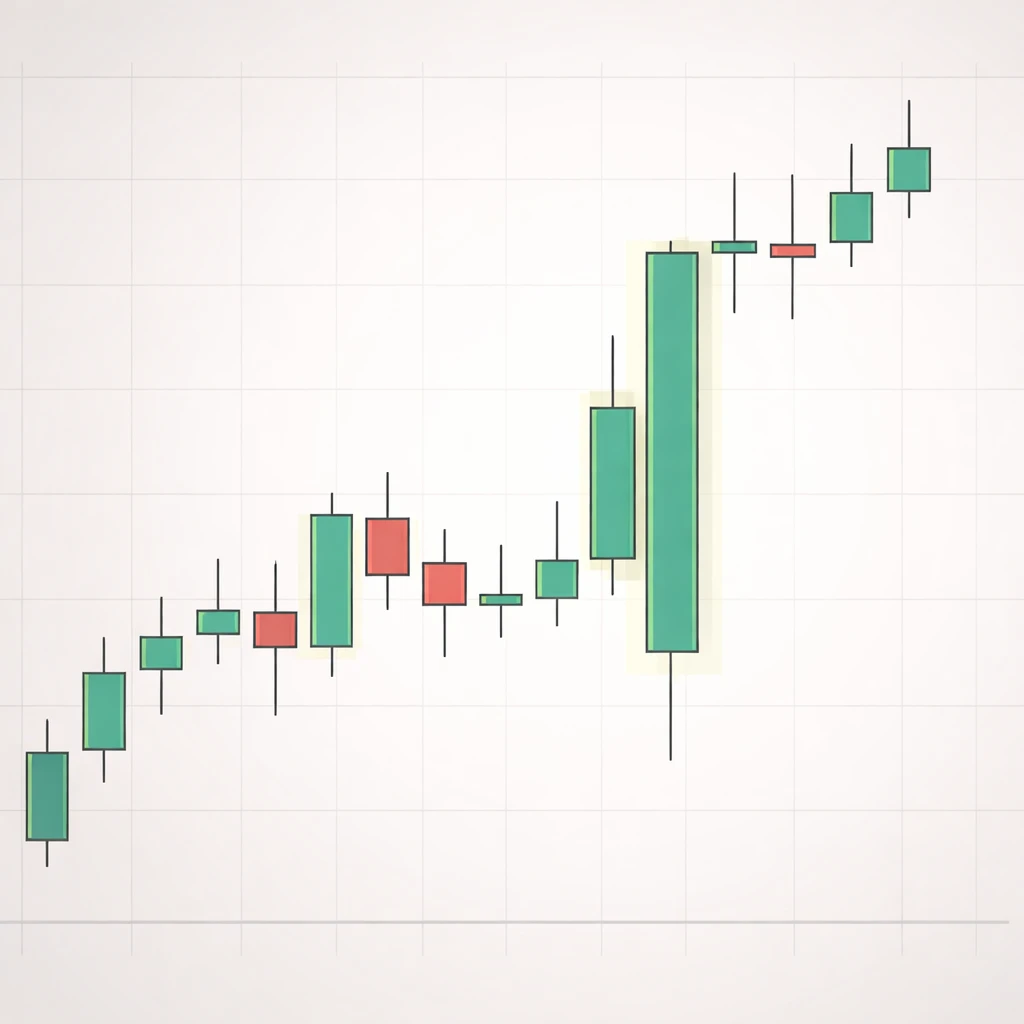
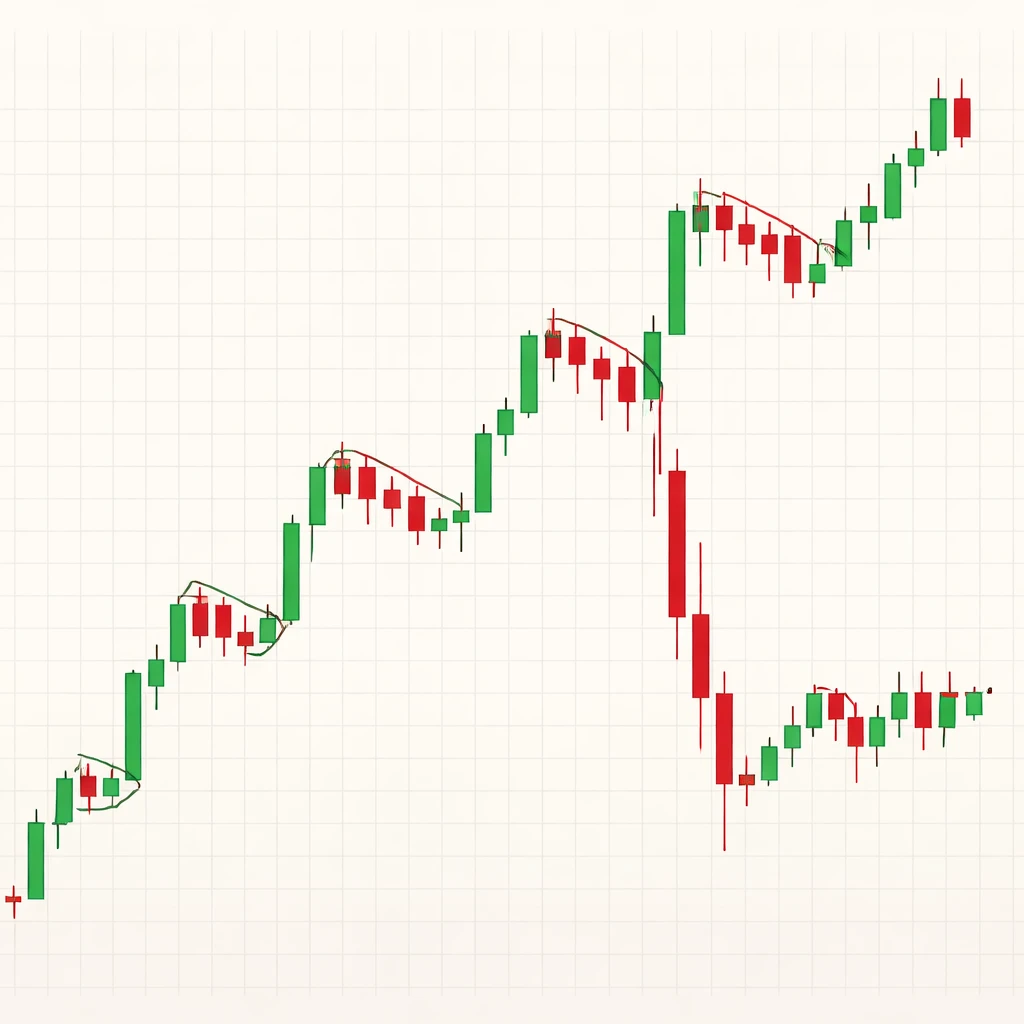
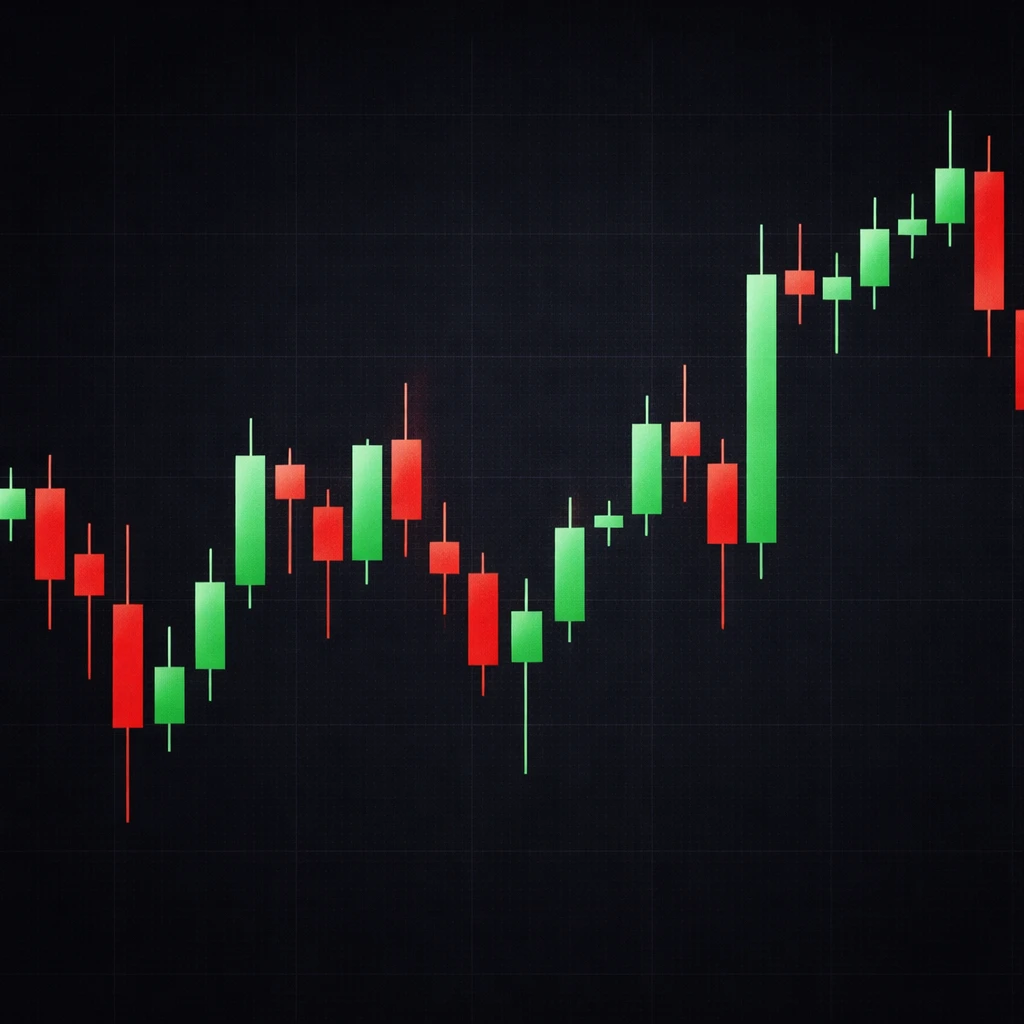
Candlesticks Explained

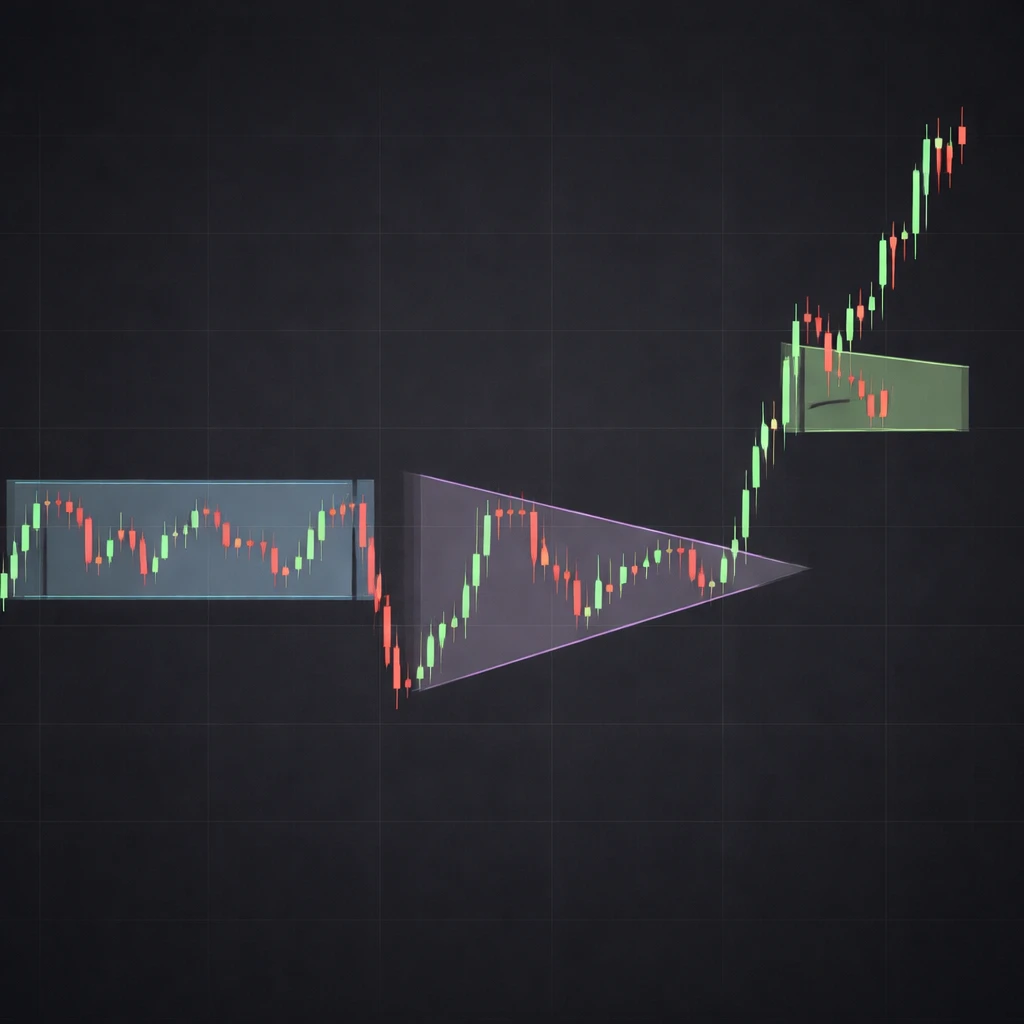
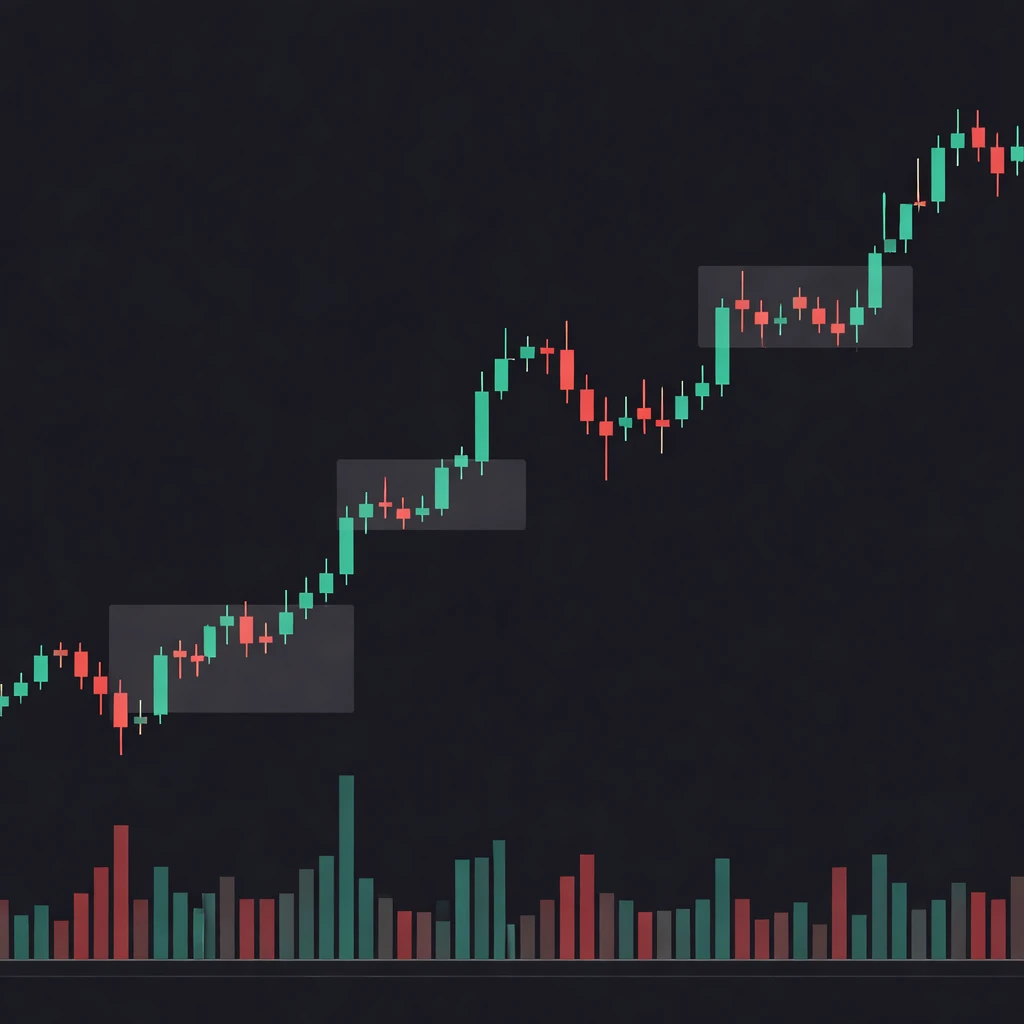
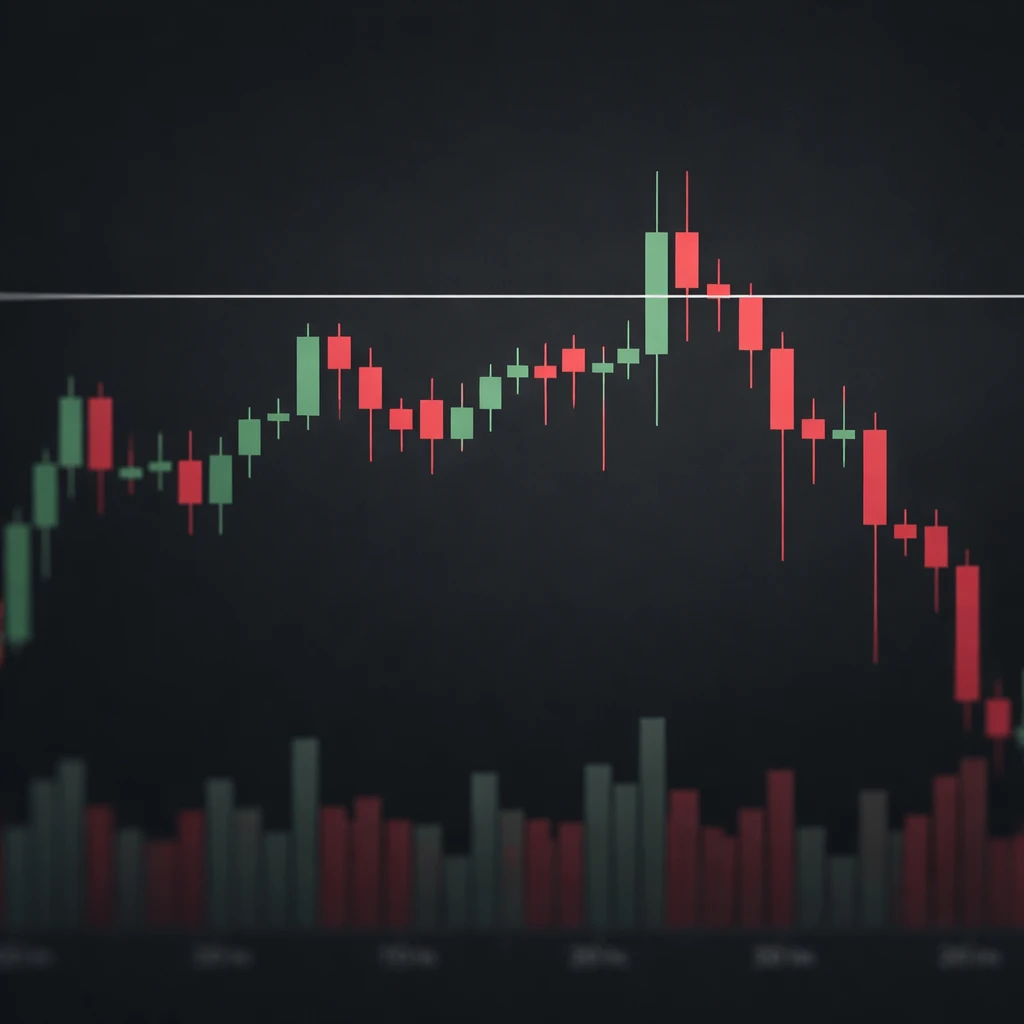
A clear, academically grounded guide to candlestick charts: how they are constructed, what they represent about intraperiod order flow, and how to read their bodies and shadows in context without drifting into prescriptive trading rules or setups. The article focuses on interpretation within price action, data nuances, and practical chart-based exa…

10 min read
Beginner

Bullish vs Bearish Candles

A detailed explanation of bullish and bearish candlesticks, how they appear on charts, what they communicate about price action, and how context such as time frame, volatility, gaps, and volume shapes interpretation. Includes practical chart-based examples without strategies or recommendations.

10 min read
Intermediate

Inside Bars Explained

An inside bar occurs when a candle’s entire high–low range fits within the prior candle’s range. This article explains what inside bars reveal about price action, where they appear on charts, and how to interpret them within broader market context, without suggesting strategies or recommendations.

11 min read
Intermediate

Wicks and Market Rejection

An in-depth explanation of candlestick wicks and the concept of market rejection, including how they appear on charts, what they imply about price discovery and liquidity, and how to place them in practical chart context without prescribing trading actions.

11 min read
Beginner

What Is Price Action?

Price action is the study of how price moves through time using the raw sequence of highs, lows, opens, and closes. It helps interpret market behavior, identify context such as trend or range, and evaluate momentum and volatility directly on the chart.

11 min read
Intermediate

Outside Bars Explained

A thorough explanation of outside bars in price action analysis. Understand the precise definition, how they appear on charts, why they are monitored, and how to read their context without relying on strategy rules or recommendations. Includes practical, chart-based examples and key interpretation nuances.

12 min read
Intermediate

Consolidation Patterns

Consolidation patterns are periods when price contracts and trades within a relatively contained range. This article explains how to recognize consolidations on charts, what they suggest about supply and demand, and how to place them in a broader analytical context without recommending trades.

9 min read
Intermediate

Price Gaps Explained

An in-depth explanation of price gaps in technical analysis, including how gaps form, how they appear on charts, why many traders monitor them, and practical chart-based context for interpreting these discontinuities in price action without proposing trading strategies.

12 min read
Intermediate

False Breaks and Traps

An in-depth explanation of false breaks and traps in price action, how they appear on charts, why they matter for interpreting order flow and market psychology, and how to place them in broader market context without prescribing trading strategies or recommendations.

10 min read
Intermediate

Impulsive vs Corrective Moves

A clear, chart-focused explanation of impulsive and corrective price moves, how they appear across timeframes, and why the distinction matters for interpreting market behavior without proposing strategies or recommendations. Written for learners seeking a rigorous understanding of price action structure.