Momentum indicators attempt to quantify how quickly price is changing. Rather than focusing on where price is, they focus on the speed and persistence of its movement. In market practice, this distinction matters because acceleration and deceleration in price often precede visible shifts in behavior. Momentum tools transform raw price series into oscillators or centered lines that are easier to compare across time and across different securities.
This article explains what momentum indicators are, how they typically appear on charts, why they draw attention from market participants, and how to place their readings into a practical chart context. Throughout, the emphasis is on interpretation rather than prescription.
What Are Momentum Indicators?
In technical analysis, momentum refers to the rate of change in price over a specified lookback. The basic intuition is familiar from physics: an object in motion has inertia. In markets, prices that move quickly in one direction often continue for some time, while faltering momentum can foreshadow pauses or reversals. Momentum indicators measure that speed in different ways. Some compare current price with price n periods ago. Others evaluate where the close sits within a recent range. Still others compare two moving averages and analyze the gap between them.
Most momentum indicators fall into two broad categories:
- Bounded oscillators that fluctuate within a fixed range, often 0 to 100. Examples include the Relative Strength Index and the Stochastic Oscillator. These emphasize overbought and oversold conditions and are easy to compare across assets because their scale is standardized.
- Centered oscillators that revolve around a neutral line, often zero. Examples include Rate of Change, Commodity Channel Index, and the MACD line or histogram. These commonly emphasize shifts around neutrality and the direction of acceleration.
Momentum indicators do not predict price. They summarize how fast price has been moving and whether that speed is strengthening or weakening. Their value is diagnostic. Used thoughtfully, they can confirm the character of a move, highlight potential exhaustion, or show when activity is clustering rather than spreading.
How Momentum Appears on Price Charts
Even without any indicators, charts reveal momentum visually. Steeper slopes, larger bodies on candlesticks, and gaps that occur in the direction of the prevailing swing point to acceleration. A trend that proceeds in small steps with frequent overlaps suggests weaker momentum. Indicators convert these impressions into numerical series, which helps standardize evaluation and compare different periods or instruments.
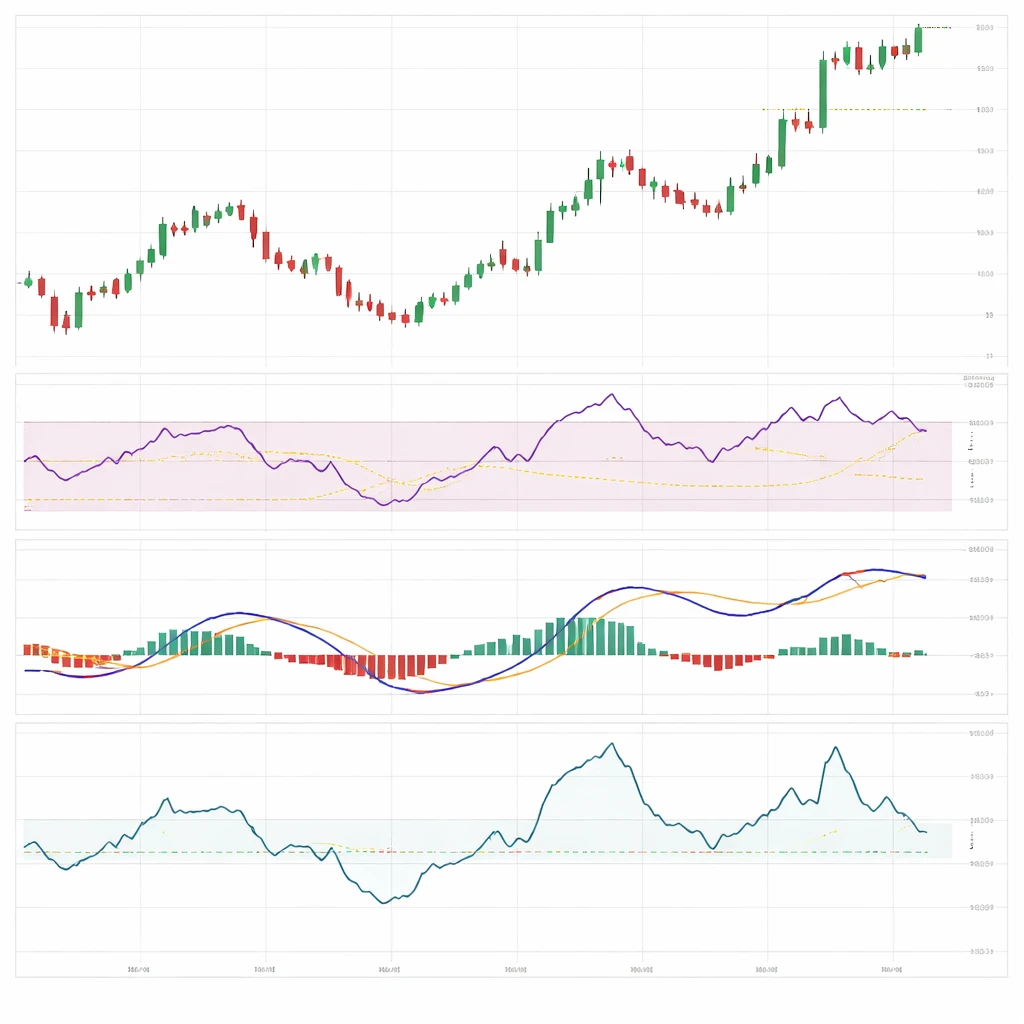
In a typical chart layout, price appears in the main pane, while momentum indicators occupy subpanes below. A bounded oscillator will oscillate between its lower and upper extremes, often with shaded regions highlighting threshold zones. A centered oscillator will hover around zero, crossing above when price acceleration turns positive and falling below when acceleration turns negative. Slopes, peaks, troughs, and crossovers provide cues about changing conditions.
Common Momentum Indicators
Rate of Change (ROC)
Concept. Rate of Change compares the current price to the price n periods ago. Some versions express this as a percentage change, while others use a simple difference. The indicator is centered around zero. Positive readings indicate that current price exceeds the past reference, and the magnitude reflects how far it has moved.
Appearance and interpretation. ROC is a single line that moves above and below zero. Surges above zero accompany strong upswings, while deep drops below zero coincide with sharp declines. A rising ROC that stays above zero indicates sustained positive acceleration. A faltering ROC that rolls over toward zero during an advance indicates fading speed. Crosses through zero often mark a change in short-term balance, though they can be frequent in choppy conditions.
Example. Suppose a stock closes at 110 today and at 100 ten sessions ago. A percentage ROC would show roughly a 10 percent value. If ROC had risen from 2 percent to 10 percent over several sessions while price staged higher highs, the indicator would be confirming accelerating upside. If price printed a marginal higher high while ROC peaked previously at 10 percent and now tops out near 6 percent, the indicator would be signaling slower acceleration despite the new price high.
Relative Strength Index (RSI)
Concept. RSI compares the magnitude of average gains to average losses over a lookback period, then maps the result onto a 0 to 100 scale. Values near the upper bound reflect predominance of recent gains, while values near the lower bound reflect predominance of recent losses.
Appearance and interpretation. RSI is drawn as a line with horizontal reference levels. Conventionally, 70 and 30 are used as upper and lower zones, although some analysts prefer 80 and 20 in strong trends. The midpoint at 50 is informative. When RSI holds above 50 during an upswing, momentum is generally positive. When it persists below 50, momentum is largely negative. Reaching an extreme value alone does not imply reversal. In persistent trends, RSI can remain elevated or depressed for extended periods. The slope and failure to maintain extremes often reveal more than a single touch of a threshold.
Example. Consider a 14-period RSI that climbs from 55 to 72 as price breaks above a multi-week range. The move through 70 confirms that recent gains outweigh losses by a sizable margin. If price then advances to a slightly higher high but RSI peaks at 66 instead of 72, the shift points to declining momentum even as price extends. Such behavior often precedes consolidation, although timing and extent vary widely.
Stochastic Oscillator
Concept. The Stochastic Oscillator evaluates where the latest close falls relative to the high-low range over a lookback period. The idea is that strong advances tend to close near the upper end of their range, and strong declines tend to close near the lower end.
Appearance and interpretation. The indicator plots two lines. %K is the raw measure of position within the range, and %D is a smoothed version of %K. The scale runs from 0 to 100. Readings above 80 indicate closes near the high of the recent range, while readings below 20 indicate closes near the low. Because Stochastic is sensitive to choppy price action, many chartists focus on the general regime of readings rather than every small twitch. Sustained time above 80 during an advance indicates persistent upward pressure. A failure to revisit high readings while price attempts another push higher suggests fatigue.
Example. On a daily chart after a strong rebound, %K climbs above 80 and remains there for several sessions. Price continues to drift upward, but %K begins to roll down toward 60 even as price ekes out a small new high. The close is no longer clustering near the top of the range, which signals waning power behind the advance.
Moving Average Convergence Divergence (MACD)
Concept. MACD compares two exponential moving averages, typically a faster and a slower one. The difference between them forms the MACD line. A moving average of that difference forms the signal line. The histogram shows the gap between MACD and its signal line.
Appearance and interpretation. The MACD line is a centered oscillator. When the fast average rises above the slow average, MACD is positive. When the fast average falls below the slow average, MACD is negative. The histogram expands when the distance between the two moving averages widens and contracts when they converge. Histograms that peak and then form a lower high while price makes a higher high capture deceleration. Crosses of MACD above or below the zero line often align with broader trend shifts, although they occur after some movement has already taken place.
Example. An index rallies from 4,000 to 4,200. The MACD histogram rises with broad bars, indicating increasing separation between the fast and slow averages. Price then nudges to 4,215, but the histogram prints smaller bars than it showed at 4,200. The indicator is recording less acceleration in the latest push compared to the earlier part of the move.
Commodity Channel Index (CCI)
Concept. CCI measures the deviation of price from its moving average, scaled by recent mean absolute deviation. Despite the name, it is used across asset classes. Readings above zero indicate price is above its recent average. The scale is unbounded, but reference levels such as +100 and -100 are commonly watched.
Appearance and interpretation. CCI is a centered oscillator that often highlights early shifts around zero. Persistent readings above +100 reflect strong positive deviation. Rolling back toward zero during an advance indicates normalization, sometimes after a stretch of overextension.
Example. After an earnings gap, a stock’s CCI prints +180 and stays above +100 for several sessions. Subsequent sessions show CCI slipping to +60 while price continues drifting slightly higher. The reduced deviation suggests price is converging back toward its moving average even though the trend has not visibly reversed.
Why Momentum Indicators Attract Attention
Market participants monitor momentum for diagnostic insight into the behavior of price. Several themes recur across practice:
- Confirmation of strength. During a directional move, momentum indicators that expand in the direction of the move add confidence that the advance or decline is broad and forceful rather than fragile.
- Assessment of exhaustion. When price pushes to new extremes but momentum indicators fail to match their prior peaks, the gap raises a question about the sustainability of the move. This does not foretell an immediate reversal, but it often precedes some form of pause or rotation.
- Standardized comparison. Oscillators compress behavior into a stable scale. A bounded indicator at 75 means roughly the same level of dominance of gains over losses regardless of the instrument or price level.
- Context for volatility. Momentum often expands alongside volatility during breakouts and contracts during consolidations. Indicators can help separate quiet drift from impulsive movement.
- Complement to trend measures. Traditional trend tools focus on direction. Momentum adds information about the quality of that direction by reflecting speed and acceleration.
Chart-Based Contexts and Practical Examples
Example 1: Breakout with Momentum Confirmation
Consider a daily chart of a large-cap stock that has oscillated between 95 and 105 for six weeks. Price closes above 105 with expanding candlestick bodies. The 14-period RSI climbs from 52 to 68 into the breakout and briefly touches 71 in the immediate aftermath. Meanwhile, the 10-period ROC moves from slightly negative to +6 percent and holds above zero for several sessions. In this context, both indicators are communicating that the move out of the range is accompanied by accelerating gains rather than a marginal overshoot. If, a few days later, RSI pulls back toward 55 while price remains near 107 to 108, the indicator suggests digestion of the initial impulse even if the price trend has not changed.
Example 2: Divergence After a Prolonged Advance
On a broad equity index, price rallies from 3,800 to 4,300 over two months, corrects to 4,200, and then pushes to a slightly higher high at 4,320. During the first peak, MACD histogram bars reach wide positive values. During the second peak, the histogram tops at smaller bars, and the MACD line itself fails to exceed its prior high. The index has printed a higher high in price with a lower high in momentum. This divergence highlights slower acceleration on the second leg. It does not prescribe a reversal. It does, however, describe a notable change in character that often precedes range development, pullbacks, or reduced follow-through.
Example 3: Momentum Extremes in Trending Markets
In a strong uptrend in a commodity future, the Stochastic Oscillator remains above 80 for long stretches, occasionally dipping toward 60 before recovering. Meanwhile, RSI oscillates mostly between 55 and 75, rarely dipping below 50. Price follows a pattern of shallow pullbacks with higher lows. This situation illustrates a key caution: overbought or oversold readings can persist. A bounded oscillator residing at an extreme does not necessarily imply imminent mean reversion. An analyst gains more information by observing how quickly the indicator leaves the extreme and whether it can return after a small dip, rather than by reacting to the first touch of a threshold.
Reading Momentum Across Timeframes
Momentum is sensitive to the timeframe observed. A fast-moving five-minute chart can show repeated swings between extremes, while a weekly chart remains steady. Conflicting readings across timeframes are common. An instrument can display negative momentum on a short-term chart while maintaining positive momentum on a longer-term chart. When comparing momentum across horizons, it is helpful to avoid conflating signals. Each timeframe is measuring a different slice of behavior, and the relevance of a given reading depends on the horizon under consideration.
Parameter choices also interact with timeframe. A 14-period oscillator on a daily chart reflects three weeks of trading sessions, while the same period on an intraday chart covers a much shorter span. Faster settings amplify noise and highlight microstructure effects such as intraday liquidity surges. Slower settings smooth those effects but respond later to genuine changes.
Parameter Choices and Smoothing
Lookback length and smoothing methods have clear trade-offs:
- Short lookbacks. Faster and more sensitive to turning points, but prone to whipsaws and false extremes in noisy conditions.
- Long lookbacks. Smoother and more stable, but slower to register changes and more likely to understate early acceleration.
- Smoothing mechanics. Exponential averages weight recent observations more than older ones, which makes indicators like MACD responsive to fresh information. Simple averages spread weight evenly. Median-based or deviation-based methods, as used in CCI, change how outliers influence the result.
The numerical thresholds that define overbought or oversold for bounded oscillators also depend on parameter choices and market conditions. A threshold that highlights reversal risk in a mean-reverting instrument can be less informative in a strongly trending one. As a result, some practitioners adapt thresholds to volatility regimes, although static levels remain common for simplicity and comparability.
Interpretation Frameworks
Several well-known frameworks help structure interpretation without dictating specific actions:
- Centerline behavior. For centered oscillators such as ROC or the MACD line, holding above zero during an advance reinforces the idea that positive acceleration persists. Frequent crosses back and forth around zero imply indecision or rangebound behavior.
- Overbought and oversold zones. For bounded oscillators such as RSI or Stochastic, readings in extreme zones describe dominance of one side. Persistence in an extreme is information about strength. The exit from an extreme often tells more about momentum loss than the entry.
- Divergence. When price makes a higher high and an indicator makes a lower high, or when price makes a lower low and an indicator makes a higher low, the indicator is recording reduced participation or speed. Divergence does not specify timing. It does refine the analyst’s understanding of the quality of the latest swing.
- Failure swings and regime shifts. Some indicators exhibit patterns where they attempt but fail to return to previous extreme levels. For example, an RSI that cannot regain 70 during a rally after having reached it earlier conveys a weaker regime, particularly if the midpoint near 50 becomes resistance for the oscillator.
- Slope and inflection. Visual attention to whether an oscillator’s slope is accelerating or decelerating around peaks and troughs can be valuable. A flattening or rolling slope often occurs before a cross of a threshold or a centerline. It provides early evidence of change without depending on a single binary event.
Limitations and Practical Cautions
No momentum indicator is universally reliable. Several limitations recur:
- Whipsaws in ranges. When price oscillates within a narrow band, momentum measures can give frequent conflicting readings. Short bursts of activity push bounded oscillators to extremes that quickly mean revert without any broader significance.
- Regime dependence. Indicators behave differently in trending versus mean-reverting environments. A level that suggests exhaustion in one regime can be ordinary in another. The same instrument can alternate regimes over time.
- Parameter sensitivity. Small changes to lookback length or smoothing can shift readings substantially. An analyst should understand how settings affect an indicator’s responsiveness rather than relying on default values blindly.
- Redundancy across indicators. Many momentum tools are correlated because they transform the same price information in slightly different ways. Combining several similar indicators rarely adds much insight. Broader context comes from pairing momentum with other forms of evidence such as trend structure, volatility measures, or volume, not from stacking multiple near-identical oscillators.
- Differences in implementation. Charting platforms can vary in calculation details, including how they treat the first few periods, rounding, and smoothing methods. Comparing values across platforms requires caution.
Integrating Momentum with Price Structure
Momentum indicators gain explanatory power when interpreted alongside price structure. Support and resistance zones, prior swing highs and lows, and the character of pullbacks frame the significance of an indicator’s reading. A centerline cross in a centered oscillator near a well-defined resistance band conveys different information than the same cross occurring in the middle of a broad range. A bounded oscillator that cannot revisit its prior extreme while price approaches a key area often signals a change in how participants are distributing their orders around that area.
Trend analysis provides a baseline. In a clear uptrend, the midpoint of bounded oscillators frequently shifts from acting as resistance to acting as support. For instance, during a healthy advance, RSI may spend more time above 50 than below. In downtrends, the reverse is common. Observing these regime behaviors helps distinguish shallow pullbacks from deeper corrective phases. Volatility context also matters. During volatility expansions, indicators traverse their ranges faster, and signals cluster. During volatility contractions, indicators compress, making extreme readings less frequent and potentially more informative when they occur.
Volume and breadth measures, while not momentum indicators in the strict price-based sense, can add complementary insight. A price advance accompanied by firm momentum and expanding volume-based participation conveys a different texture than one accompanied by fading momentum and thin participation. The point is not to assemble a checklist, but to read momentum as one component of a coherent market narrative grounded in observable structure.
Practical Reading without Prescriptions
Because momentum indicators are descriptive, their most productive use lies in shaping expectations about behavior rather than dictating specific actions. If momentum confirms a move, follow-through is statistically more plausible than if momentum is contracting, but the range of possible paths remains wide. If momentum diverges from price, consolidation becomes more likely, yet timing remains uncertain. Such statements are probabilistic and contextual, not deterministic. They are also sensitive to the timeframe and the level of granularity under study.
Continuous attention to indicator slope, persistence in regimes, and behavior around thresholds can refine real-time interpretation. Equally important is restraint. Not every small fluctuation in an oscillator reflects meaningful change in market character. Emphasis on clusters of evidence rather than isolated prints reduces the risk of overreacting to noise.
Concluding Perspective
Momentum indicators translate the pace of price into standardized, comparable series. Bounded oscillators highlight when gains or losses dominate recent activity and how persistently that dominance holds. Centered oscillators highlight the presence, absence, and direction of acceleration. When aligned with price structure and volatility context, these tools help an analyst articulate whether a move is strengthening, stalling, or resetting. The interpretations are not instructions. They are observations that can make the reading of charts more disciplined and less subject to arbitrary impressions.
Key Takeaways
- Momentum indicators measure the speed of price change, either within a bounded scale or around a neutral line, and are diagnostic rather than predictive.
- On charts, momentum appears as oscillators that confirm strength, flag potential exhaustion, or describe regime persistence across different timeframes.
- RSI, Stochastic, ROC, MACD, and CCI offer complementary views of acceleration, range position, and deviation from recent averages.
- Interpretation frameworks such as centerline behavior, overbought and oversold zones, divergence, and indicator slope help structure analysis without prescribing trades.
- Momentum tools have limitations, including sensitivity to parameters and market regime, and are most informative when read alongside price structure and volatility context.