Indicators & Oscillators

Common technical indicators such as moving averages, RSI, MACD, and momentum tools.

Part of Technical Analysis

What you will learn

This scope is designed to help you build a practical understanding of Indicators & Oscillators. Lessons move from core definitions to real-world context and common failure points.

Lessons

Reading in order is recommended, but each lesson stands on its own.

10 min read
Beginner

What Are Technical Indicators?

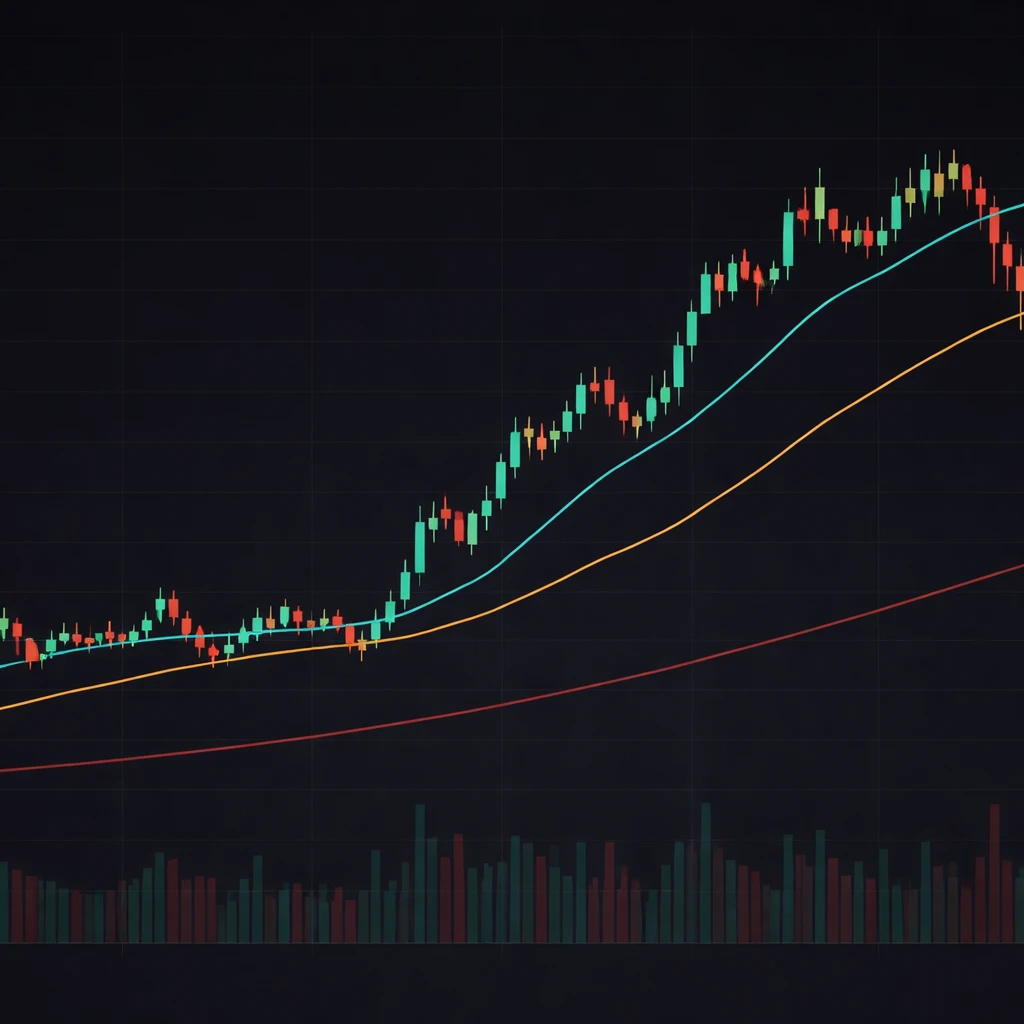
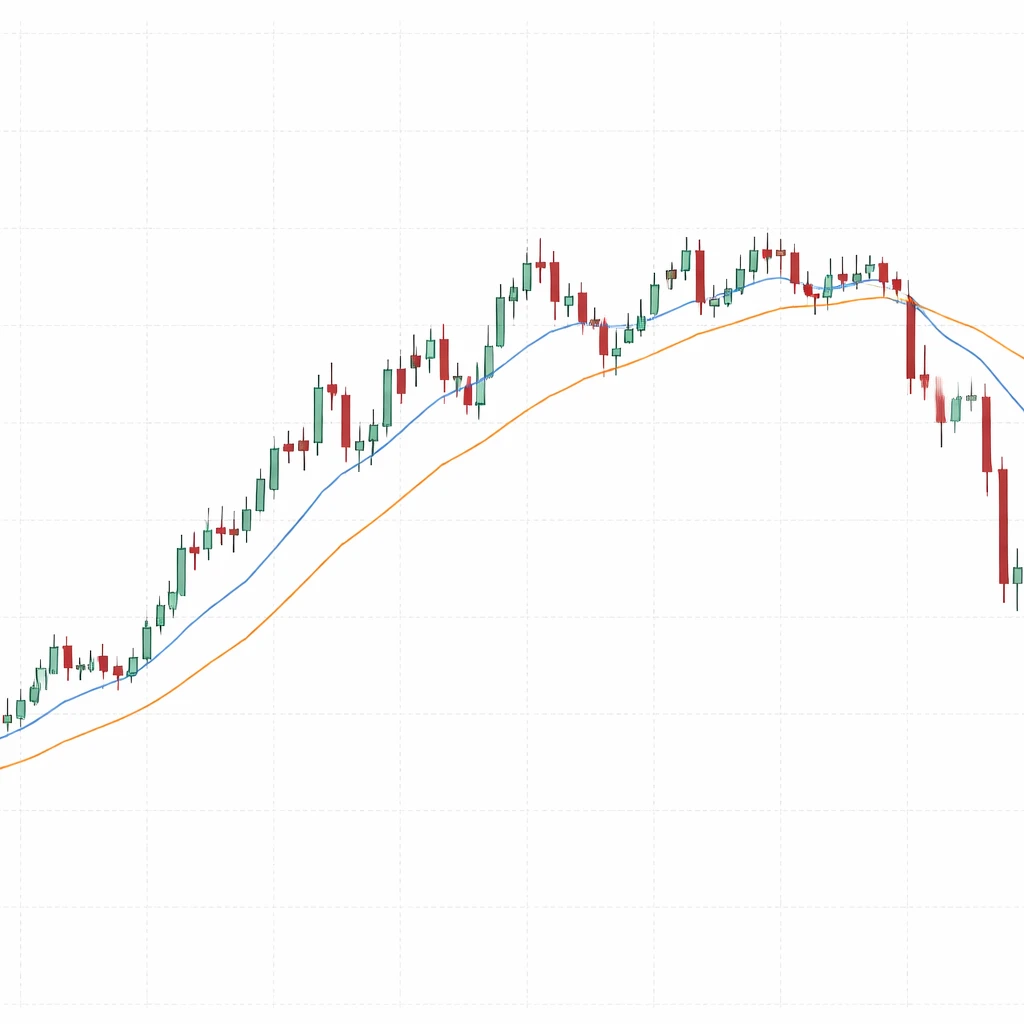
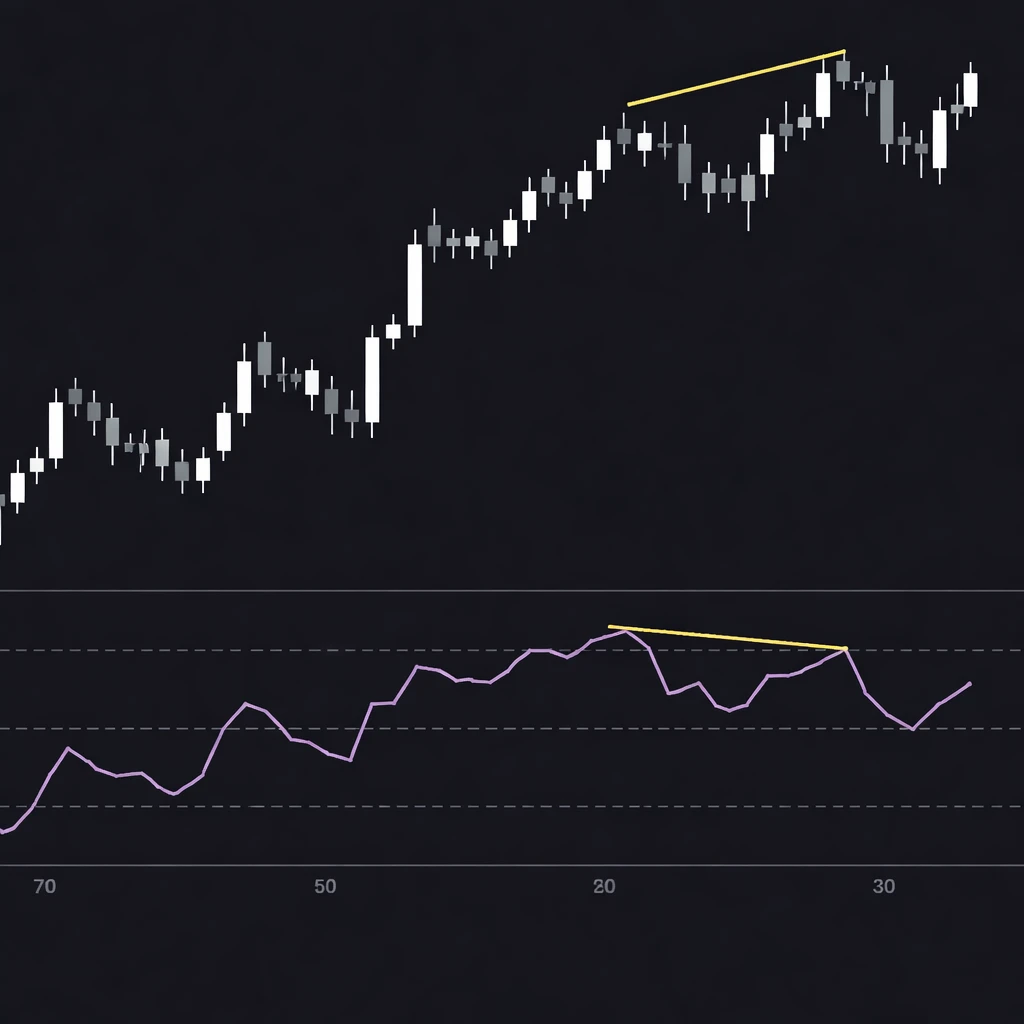
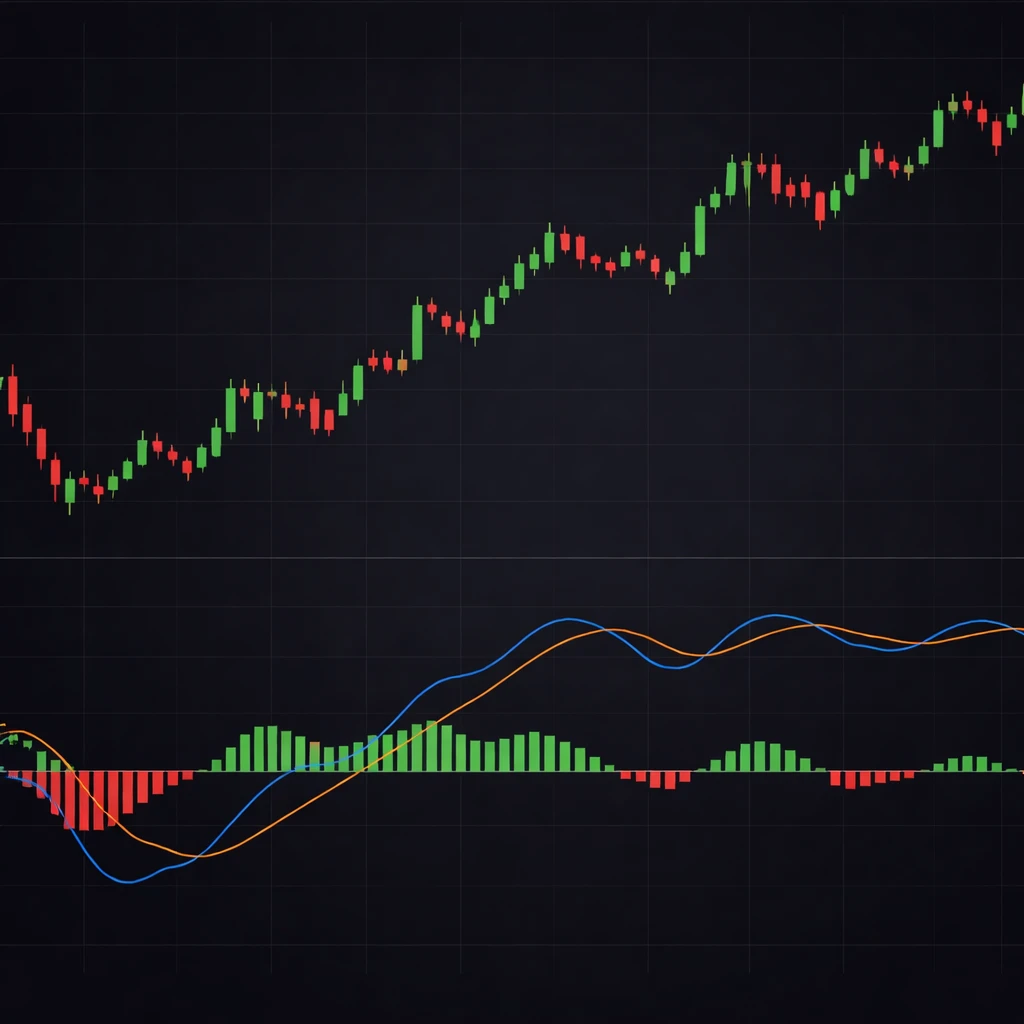
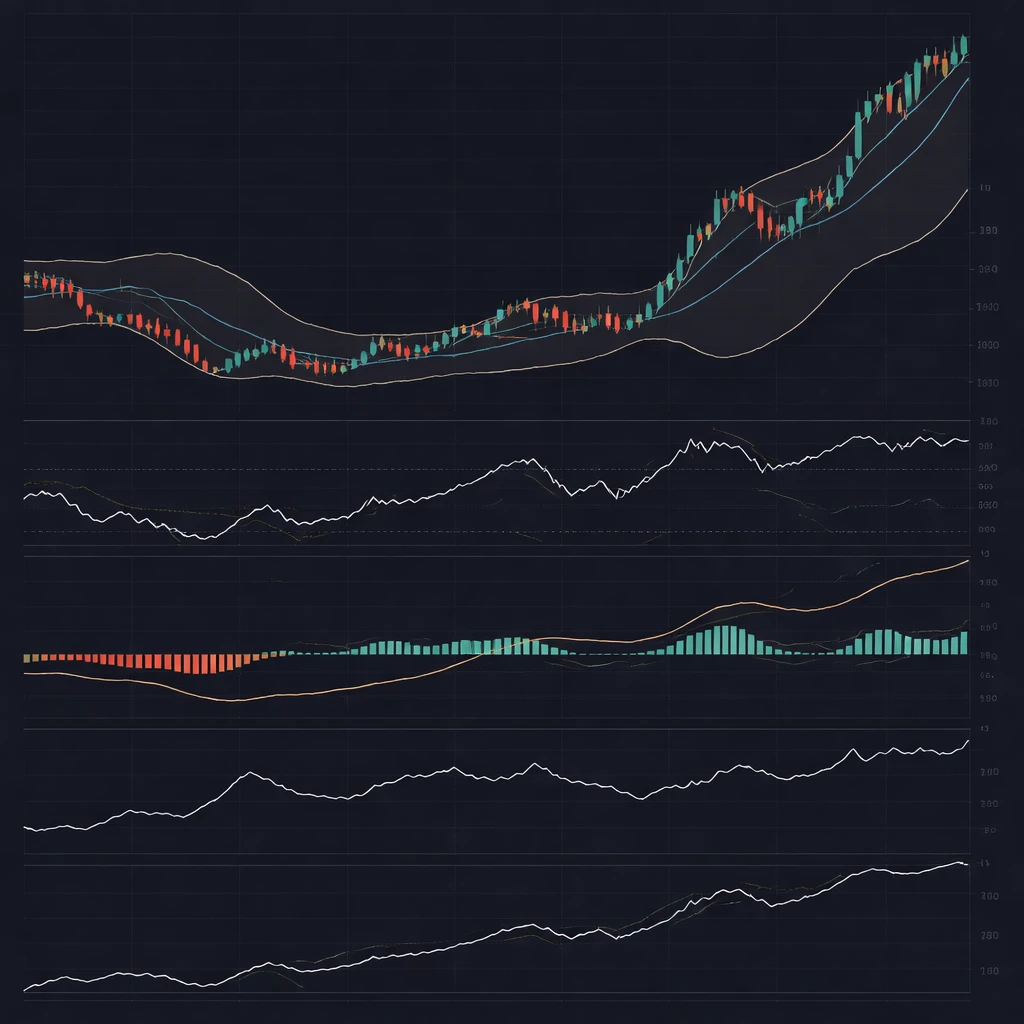
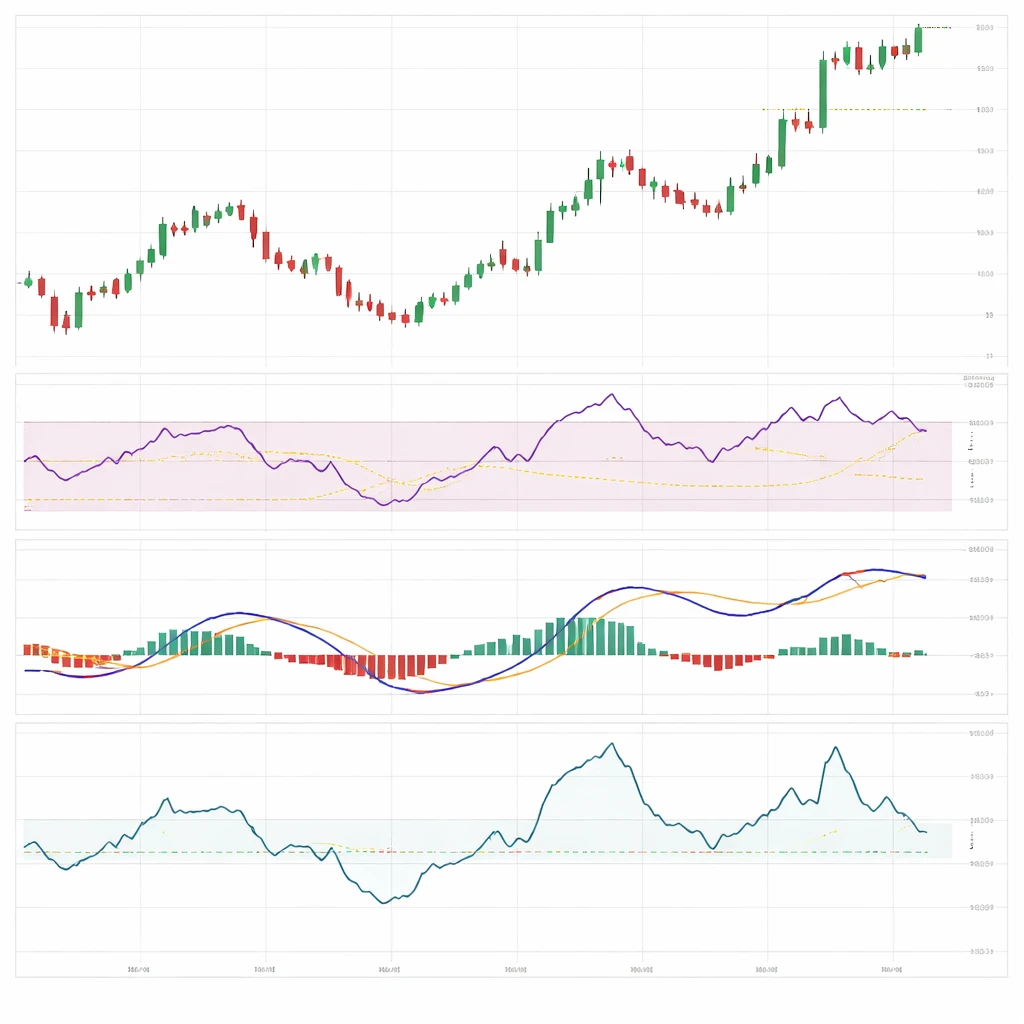
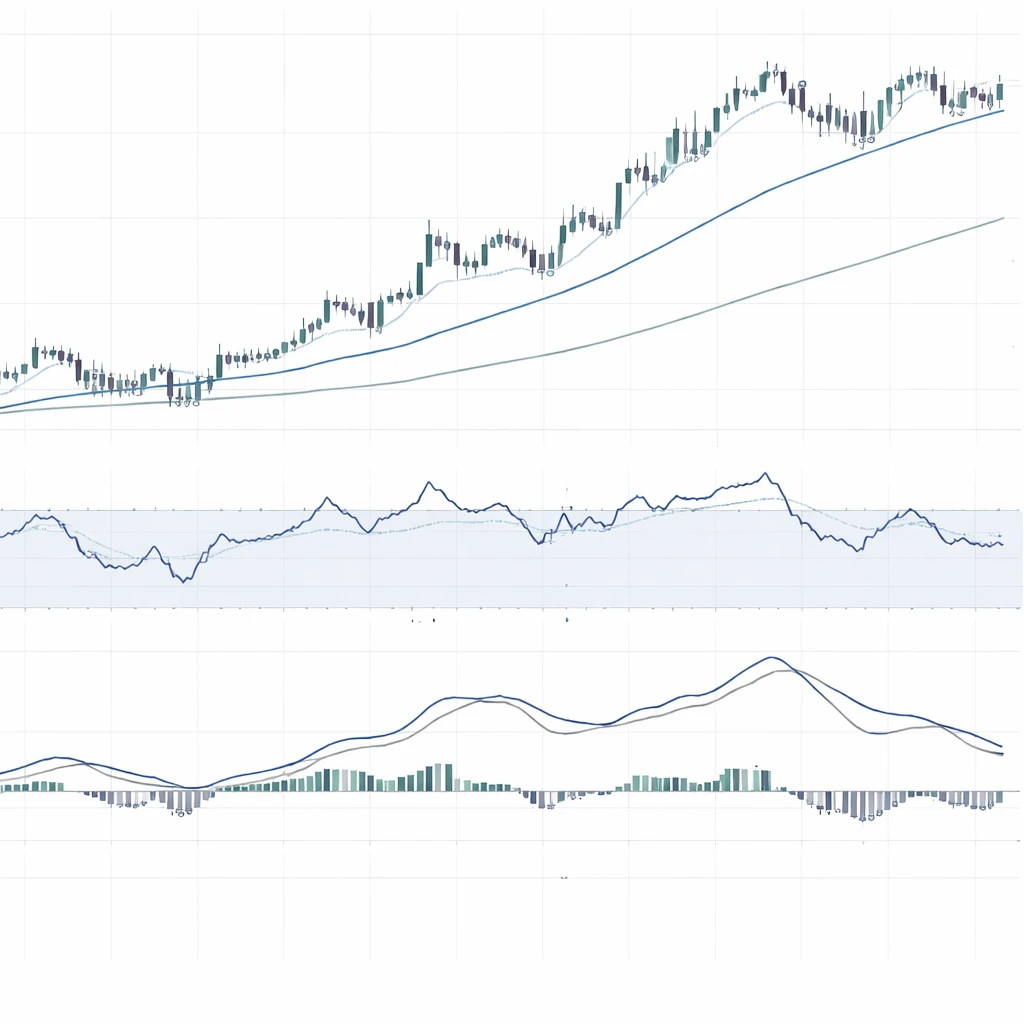
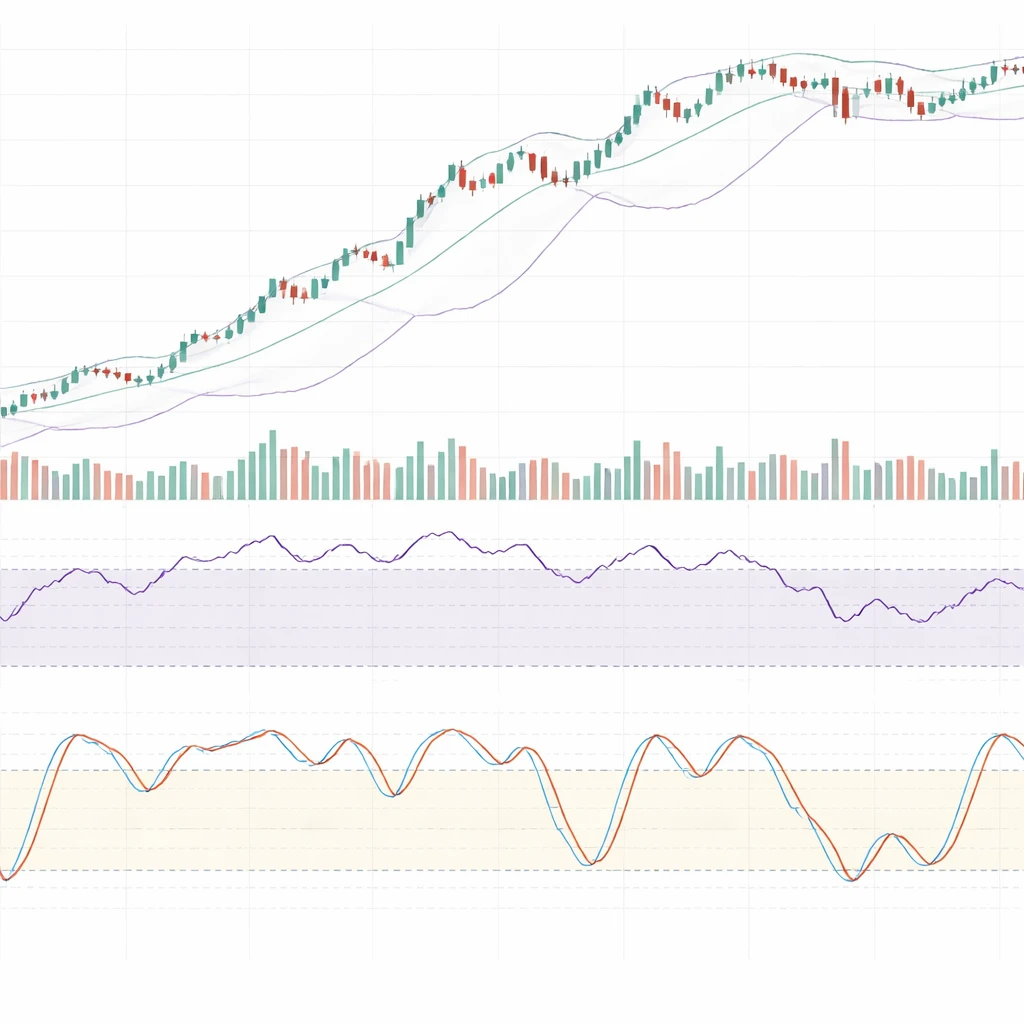
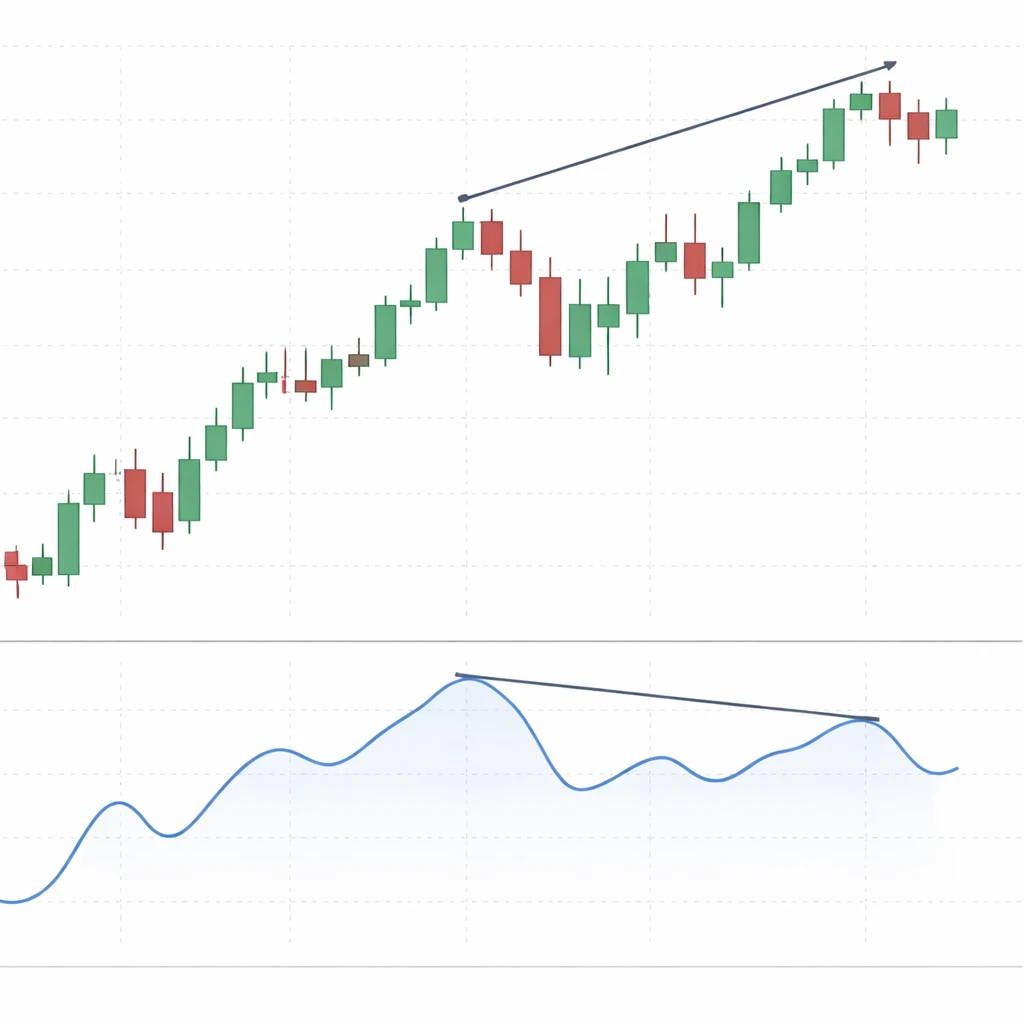
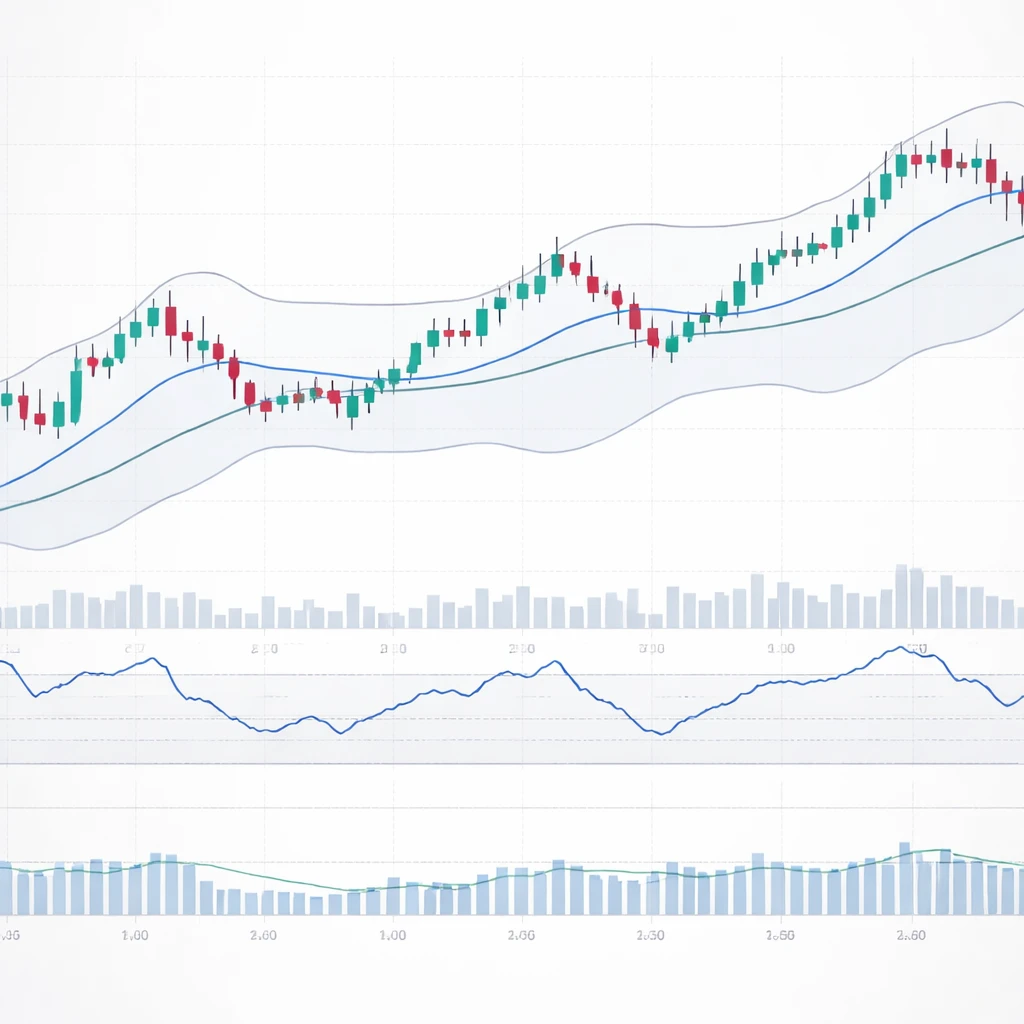
Technical indicators are quantitative transformations of market data that appear as lines, bands, or oscillators on a price chart. They help interpret trend, momentum, volatility, and participation without prescribing trades. This article explains what they are, how they are displayed, why market participants watch them, and how to read them in pra…

12 min read
Beginner

Moving Averages Explained

A rigorous, chart-focused explanation of moving averages, how they are constructed, what they look like on price charts, why analysts watch them, and how to interpret their smoothing and lag properties without implying trading decisions or setups.','content':'Moving averages are among the most widely used tools in technical analysis. They transform…

10 min read
Intermediate

Simple vs Exponential Moving Averages

An in-depth explanation of Simple and Exponential Moving Averages, how they are calculated, how they appear on charts, and why many market participants watch them to interpret price behavior and trend context, without presenting trading strategies or recommendations.

12 min read
Beginner

RSI Explained

A rigorous, chart-focused explanation of the Relative Strength Index, how it is constructed, how it appears on charts, and why many traders monitor its signals about momentum and potential exhaustion, with practical examples and clear limitations. No strategies or recommendations are provided.

12 min read
Beginner

MACD Explained

The Moving Average Convergence Divergence (MACD) condenses trend and momentum information into a single indicator built from exponential moving averages. This article defines MACD, shows how it appears on charts, explains why it matters, and illustrates its interpretation with practical, chart-based context.

11 min read
Intermediate

Indicator Confluence Explained

Indicator confluence refers to multiple, independent indicators aligning to describe the same underlying price condition. This article defines the concept, shows how it appears on charts, explains why analysts monitor it, and provides practical, chart-based context without proposing trades or setups.

12 min read
Intermediate

Momentum Indicators Explained

A clear, academically grounded explanation of momentum indicators in technical analysis, how they appear on charts, why market participants monitor them, and how to read them in practical, chart-based contexts without offering trading advice or setups.

10 min read
Intermediate

Leading vs Lagging Indicators

An in-depth explanation of leading and lagging indicators in technical analysis, how they appear on charts, why they matter for interpreting price behavior, and what to watch for in real market contexts without prescribing trades or strategies. Readers will learn how these tools transform price data and how to read their signals with proper caution…

10 min read
Intermediate

Overbought and Oversold Concepts

A clear, academically grounded explanation of overbought and oversold concepts in technical analysis, how they appear on charts through oscillators and bands, why analysts pay attention to these readings, and how to interpret them within market context without implying strategy or advice.

12 min read
Intermediate

Indicator Divergences

A detailed explanation of indicator divergences in technical analysis, including how they appear on charts, why they matter, and how to interpret them with practical, chart-based examples. No strategies or recommendations are provided, only conceptual understanding.