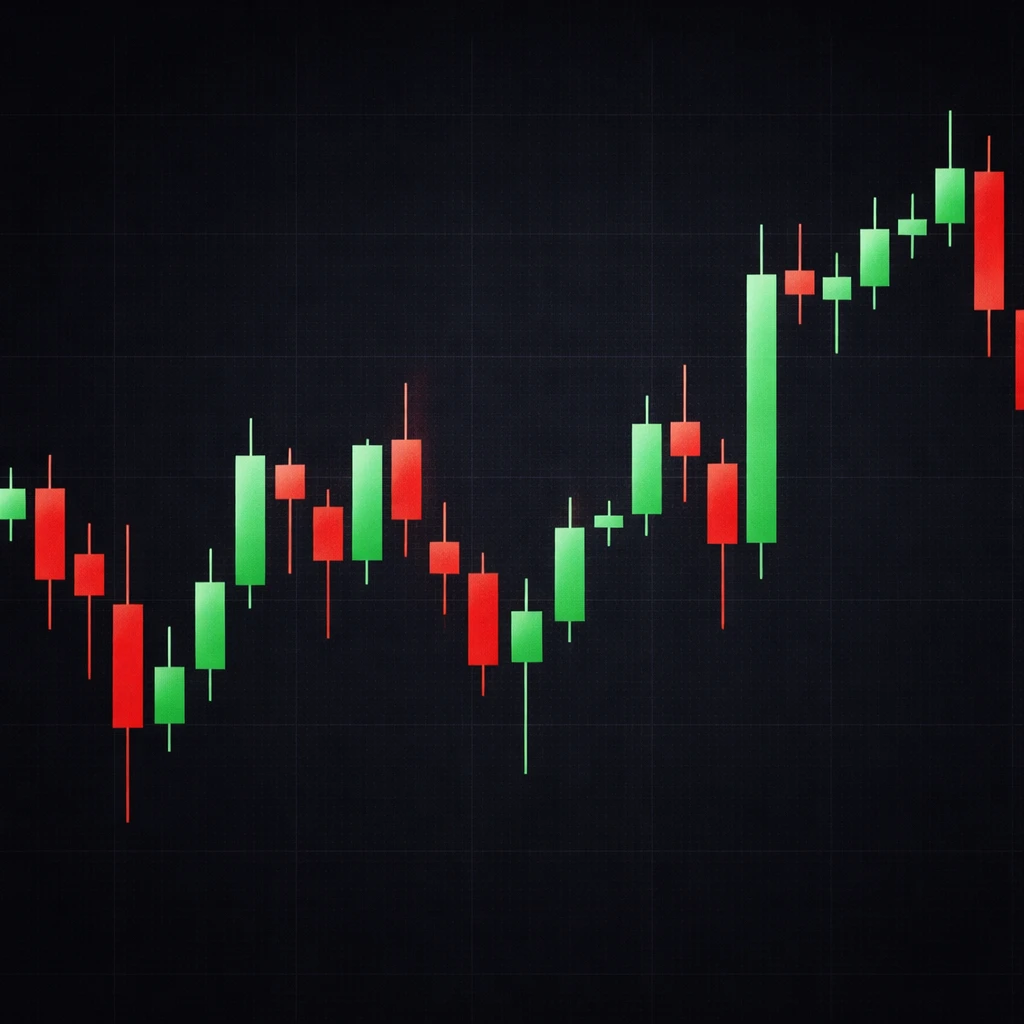
Technical Analysis
Understanding market price behavior through chart patterns, trends, support and resistance, volume, indicators, and price-based market structure.
You will learn: The core concepts in this topic, common misconceptions, and how professionals think about the subject.
Educational content only. Not financial advice.
What you will get from this topic
- Clear definitions and real-world context
- Practical examples without trade recommendations
- Common mistakes to avoid
- A progression from basics to deeper understanding
Scopes in Technical Analysis
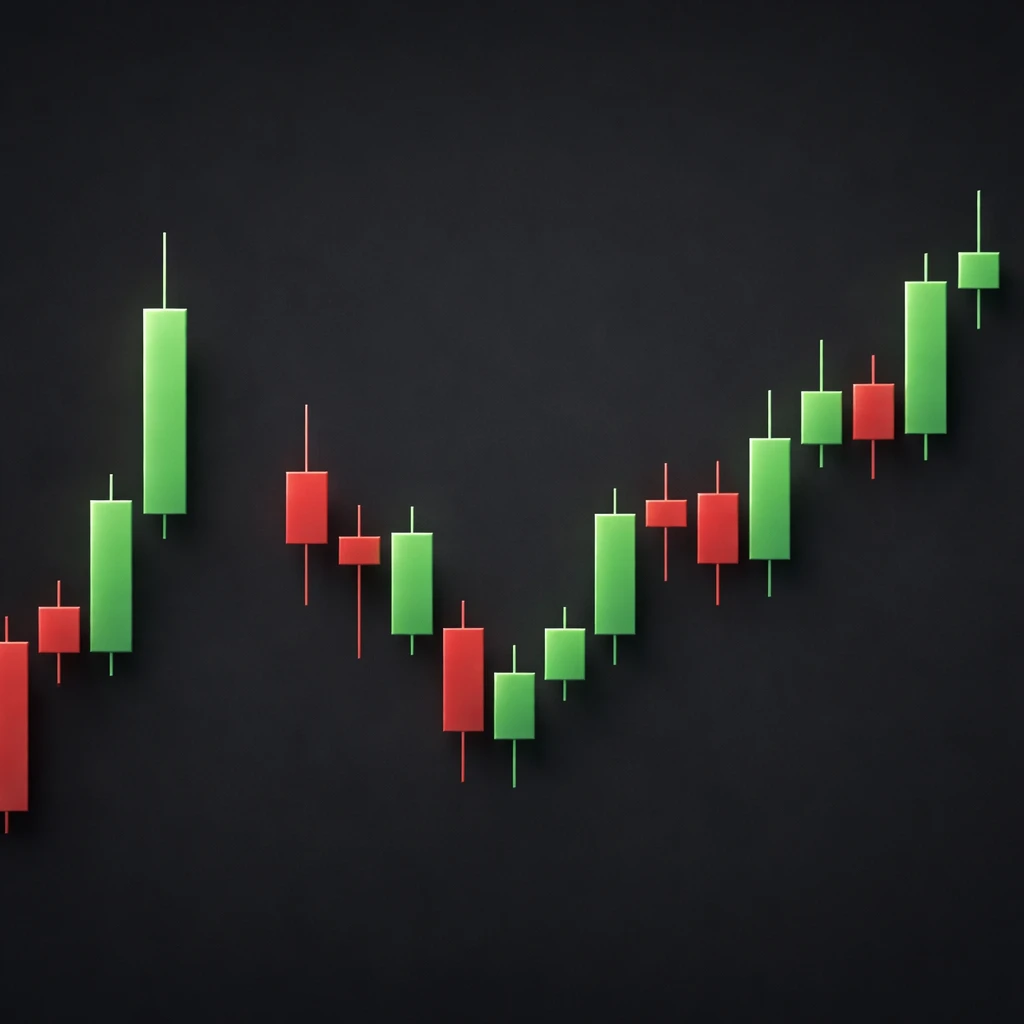
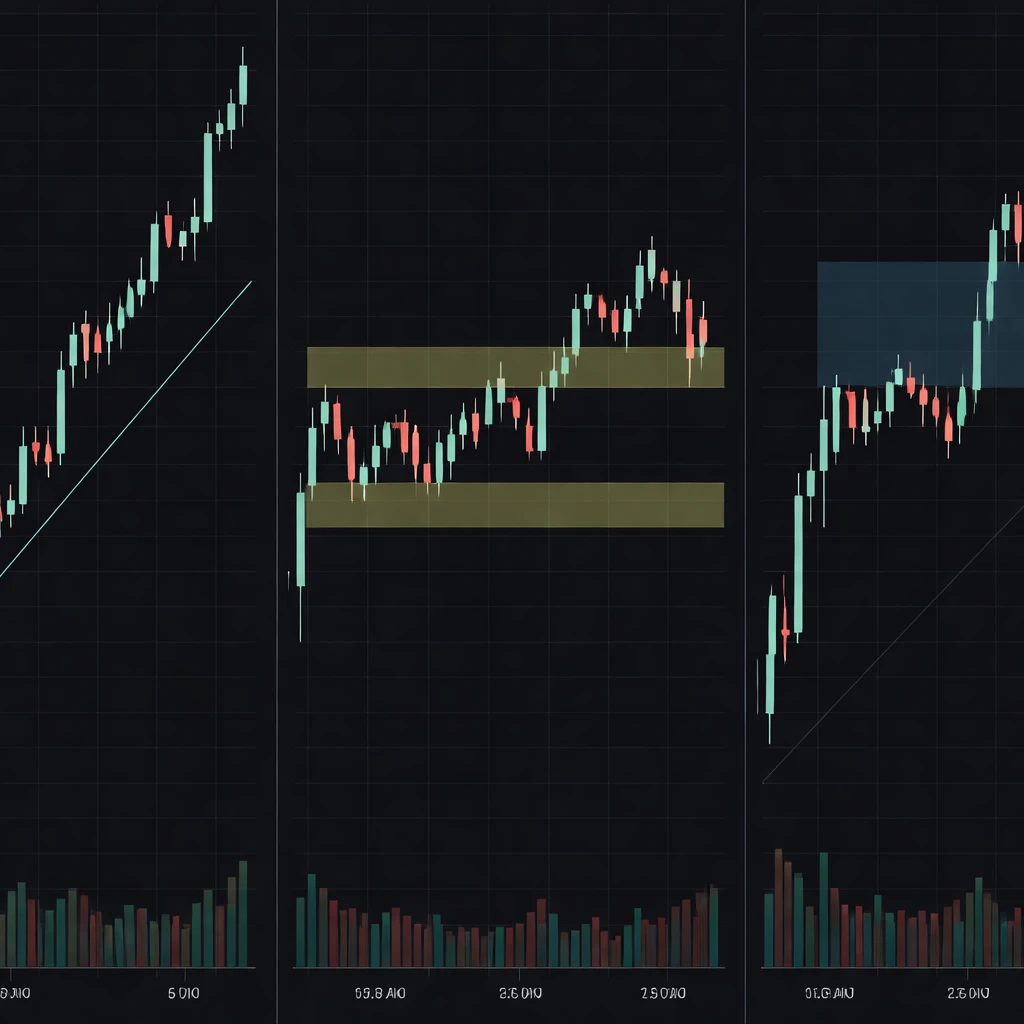
Price Action
Analyzing market behavior using raw price movement without heavy reliance on indicators.
Explore ScopeTrends & Market Structure
Identifying trends, ranges, breakouts, and overall market structure.
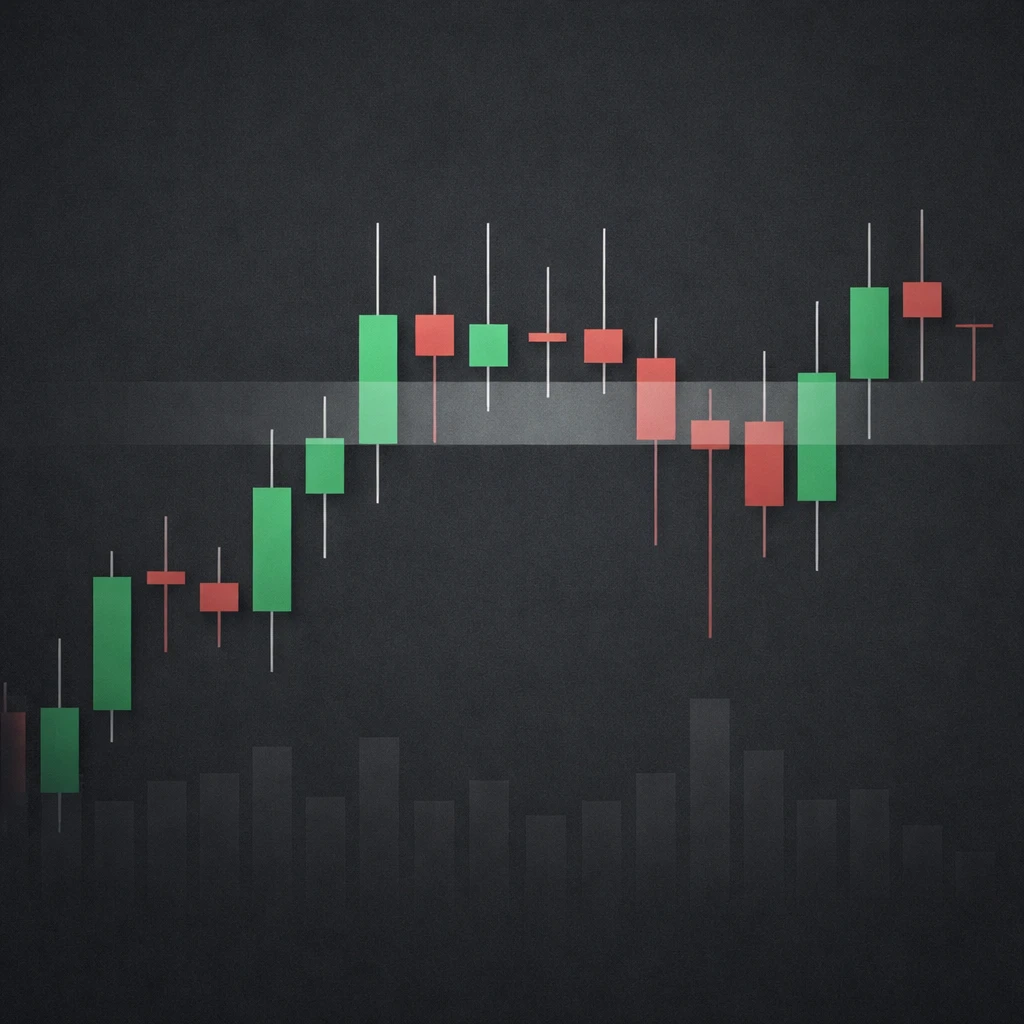
Explore ScopeSupport & Resistance
Key price levels where buying or selling pressure historically emerges.
Explore ScopeIndicators & Oscillators
Common technical indicators such as moving averages, RSI, MACD, and momentum tools.
Explore ScopeVolume & Volatility
Understanding participation, volatility expansion, and market conviction.
Explore ScopePopular in Technical Analysis
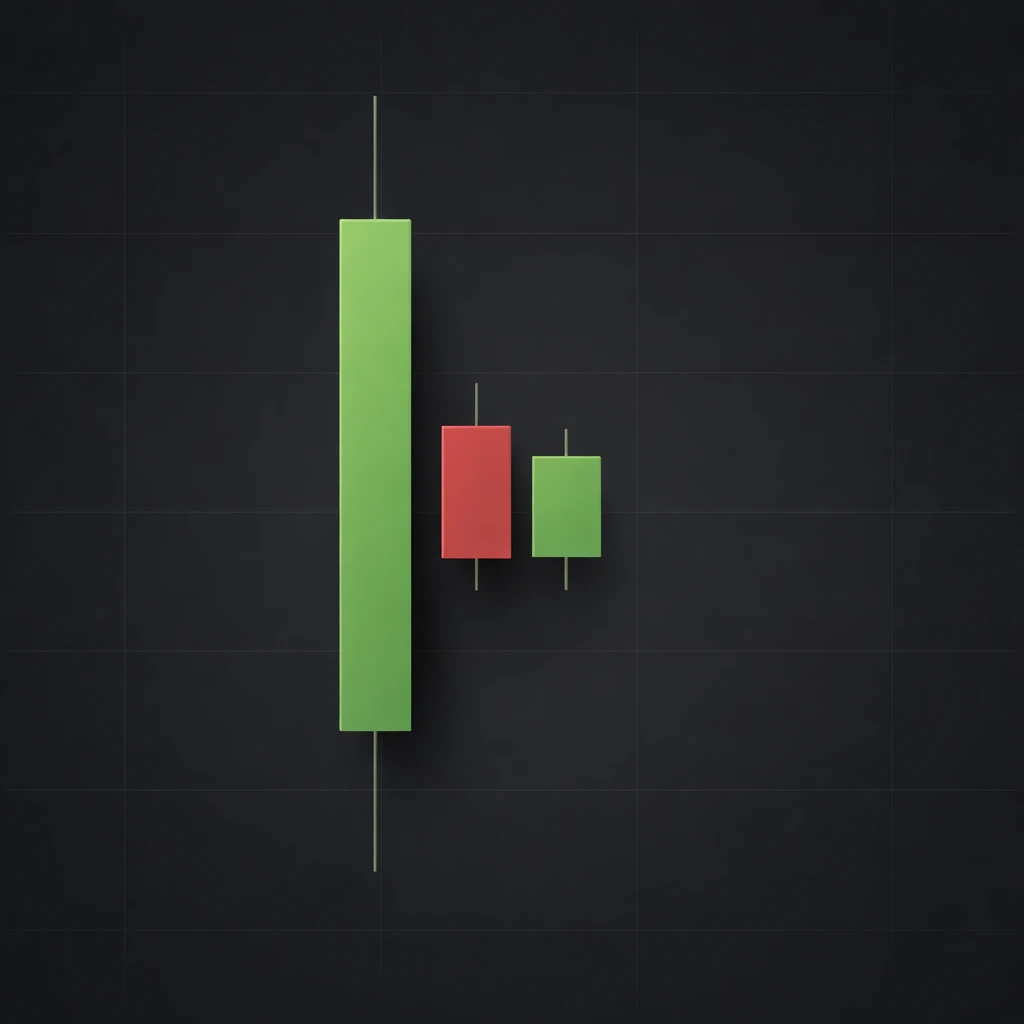
Candlesticks Explained
A clear, academically grounded guide to candlestick charts: how they are constructed, what they represent about intraperiod order flow, and how to read their bodies and shadows in context without drifting into prescriptive trading rules or setups. The article focuses on interpretation within price action, data nuances, and practical chart-based examples.
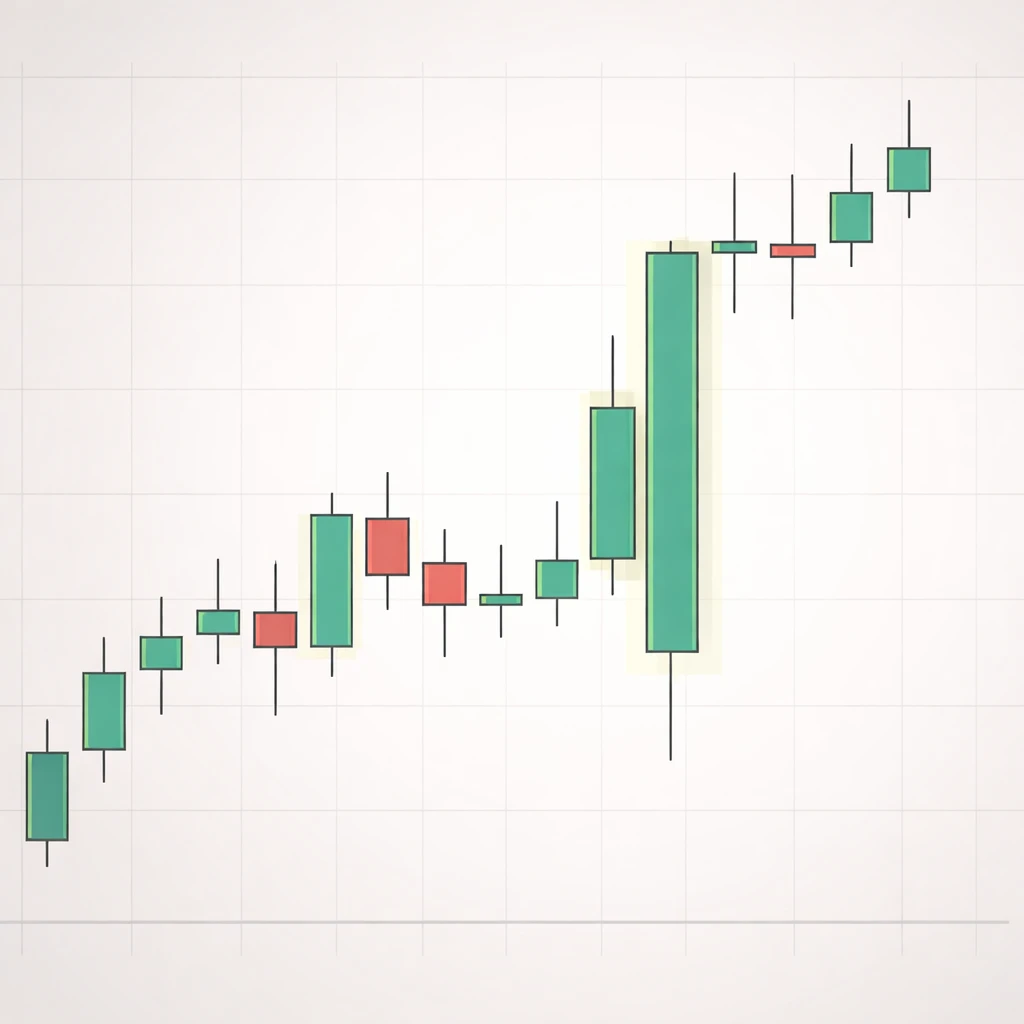
Bullish vs Bearish Candles
A detailed explanation of bullish and bearish candlesticks, how they appear on charts, what they communicate about price action, and how context such as time frame, volatility, gaps, and volume shapes interpretation. Includes practical chart-based examples without strategies or recommendations.
Inside Bars Explained
An inside bar occurs when a candle’s entire high–low range fits within the prior candle’s range. This article explains what inside bars reveal about price action, where they appear on charts, and how to interpret them within broader market context, without suggesting strategies or recommendations.
Wicks and Market Rejection
An in-depth explanation of candlestick wicks and the concept of market rejection, including how they appear on charts, what they imply about price discovery and liquidity, and how to place them in practical chart context without prescribing trading actions.
What Is Price Action?
Price action is the study of how price moves through time using the raw sequence of highs, lows, opens, and closes. It helps interpret market behavior, identify context such as trend or range, and evaluate momentum and volatility directly on the chart.
Outside Bars Explained
A thorough explanation of outside bars in price action analysis. Understand the precise definition, how they appear on charts, why they are monitored, and how to read their context without relying on strategy rules or recommendations. Includes practical, chart-based examples and key interpretation nuances.
Ready to begin?
Start with the first scope to build a clean foundation, then move forward in order.
Start Price Action