Drawdowns sit at the center of practical risk management. They quantify how far an equity curve falls from a prior peak and how long it takes to recover. Traders and portfolio managers live with this path of returns, not the average or the annualized figure that often dominates reports. A strategy that compounds at a high rate can still fail if the path contains deep or prolonged losses that exhaust capital or threaten mandate constraints. Understanding why drawdowns matter is therefore fundamental to preserving capital and remaining viable across cycles.
Defining Drawdowns Precisely
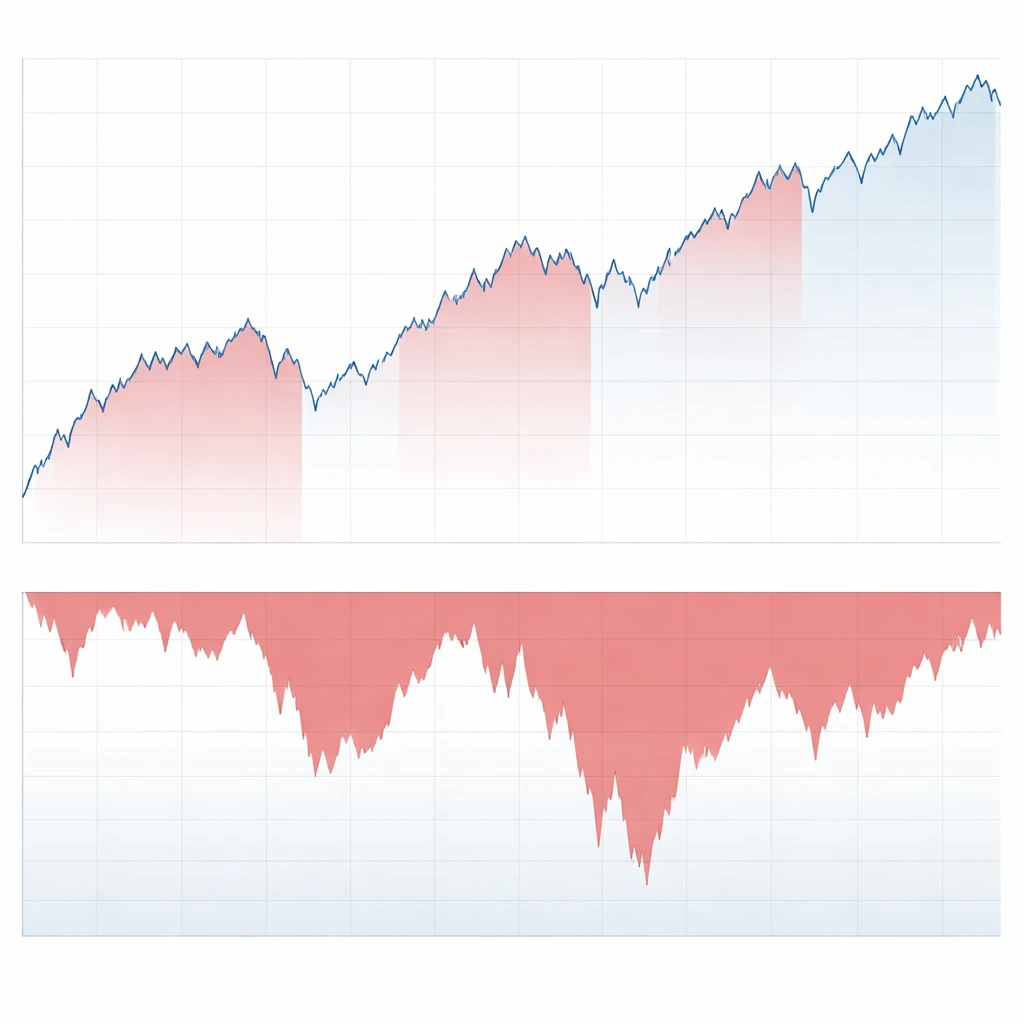
A drawdown is the decline from a historical peak in portfolio value to a subsequent trough, expressed as a percentage of that peak. If an account reaches 120, then falls to 90 before making a new high, the drawdown is (120 − 90) ÷ 120 = 25 percent. The concept extends beyond depth to include duration. Duration measures the time from the peak to the moment the portfolio value returns to or exceeds that peak. Many risk reports visualize this with an underwater chart that plots percentage distance below the high-water mark through time.
Maximum drawdown is the largest peak-to-trough decline observed over a specified period. It is simple to understand and communicate, yet it is a single worst observation that does not fully describe the distribution of losses. Other useful descriptors include:
- Average drawdown: the mean depth across all drawdowns in the period.
- Median drawdown: the typical drawdown experienced, less sensitive to outliers.
- Average duration: how long drawdowns usually last before recovery.
- Time under water: the proportion of time spent below the peak.
These measures capture both how far and how often the equity curve moves away from its high-water mark. Together they inform expectations about the lived experience of the strategy.
Why Drawdowns Matter for Risk Control
Drawdowns matter for reasons tied to compounding, constraints, and behavior. The first is arithmetic. Losses are asymmetric in their effect on capital because returns compound multiplicatively. A loss of L requires a larger gain to recover. If the portfolio declines by 20 percent, it must gain 25 percent to break even. A 50 percent loss requires a 100 percent gain to recover. This recovery asymmetry intensifies as drawdowns deepen.
Volatility also interacts with compounding. Two strategies with the same average return can produce different terminal wealth if one has larger swings that create deeper drawdowns. The reason is volatility drag. Period by period, multiplicative compounding penalizes variability. A sequence such as +10 percent, −10 percent yields a net loss of 1 percent even though the arithmetic average is zero. Drawdowns encode this penalty by revealing when variability clusters on the downside.
Practical constraints amplify the importance of drawdowns. Lenders, brokers, and risk committees set margin, leverage, and stop-out rules that depend on equity cushion. Deep drawdowns bring the portfolio closer to hard thresholds that can force deleveraging or liquidation. Even without external constraints, institutional mandates often include maximum loss limits or volatility bands that trigger risk reductions as drawdowns deepen.
Behavioral responses are a third reason. People under sustained losses are more likely to deviate from process, truncate research, or exit at unfavorable times. Drawdown statistics set expectations about stress levels and inform whether the process is likely to be followed during difficult periods. A design that anticipates stress and keeps drawdowns within tolerable bounds is more robust than one that relies on idealized discipline.
Drawdowns in Real Trading Scenarios
Drawdowns occur in many shapes. The depth and duration depend on market structure, leverage, liquidity, and correlation dynamics.
Leveraged futures portfolio. A trader runs a diversified set of futures positions sized to recent volatility. A cluster of macro shocks increases cross-asset correlations and widens spreads. The portfolio experiences a 15 percent drawdown within two weeks. Although the depth is moderate, margin requirements rise as volatility increases, which tightens available cash. The trader reduces positions to stay within margin limits. The reduction slows the potential recovery, extending the drawdown duration.
Long-only equity strategy. An equity manager invests in a concentrated portfolio of mid-cap stocks. Earnings disappointments and a cyclical downturn drive correlated losses and a 35 percent drawdown over six months. The market recovers afterward, but the manager had reduced exposures after violating a mandate risk limit. The equity curve takes two years to reach a new high. The capital preserved by de-risking supported long-term survival, but duration costs are visible in the underwater profile.
Systematic cross-asset strategy. A rules-based strategy historically benefits from low correlations across asset classes. In a crisis, correlations rise and all risk exposures move together. A drawdown develops despite diversification that worked in normal periods. The key insight is that diversification can compress drawdowns only when correlation assumptions hold. The path is dominated by the joint, not separate, behavior of exposures.
Illiquid or gap-prone markets. In thinly traded assets, prices adjust in steps and liquidity disappears during stress. Slippage widens losses beyond model expectations. The recorded drawdown includes the impact of exit prices that were not forecast by day-to-day volatility estimates. The realized drawdown thus captures liquidity risk, which is often underrepresented in variance-based models.
Metrics That Illuminate Drawdowns
Maximum drawdown is important but insufficient by itself. Several complementary metrics help build a fuller picture.
- Calmar or MAR ratio: annualized return divided by maximum drawdown over the same period. This ratio contextualizes return by the worst observed loss.
- Ulcer Index: the root mean square of percentage drawdowns across time, which penalizes both depth and duration of being under water.
- Recovery factor: cumulative net profit divided by maximum drawdown. A higher value indicates that profits have been large relative to the worst loss experienced.
- Average and median durations: a practical gauge of how long participants typically wait to recover. Duration is as relevant as depth for many mandates.
- Underwater chart diagnostics: visualizing clusters of losses, plateau phases, and recovery slopes to infer path characteristics that may be hidden in single statistics.
When comparing strategies, one must align the measurement window and scaling. Annual return paired with a maximum drawdown spanning multiple years can mislead. Scaling a strategy to a common volatility level can change drawdown statistics, yet leverage limits and liquidity constraints may prevent such scaling in practice. Context matters.
Compounding, Sequence Risk, and Time Under Water
The same average return can produce very different outcomes depending on the sequence of gains and losses. If negative returns occur early, they reduce the base on which later positive returns compound. Two paths with identical average and volatility can deliver distinct terminal wealth because the bad sequence arrives at different times.
Drawdown metrics capture this path dependence. Time under water is a way to quantify how long capital is not compounding at previous peaks. Longer durations imply higher opportunity cost and larger behavioral strain. A persistent, shallow drawdown can be more challenging than a quick, deep one because it consumes time and attention, even if the ultimate depth is smaller.
Capital preservation is closely tied to sequence risk. Smaller drawdowns maintain optionality by keeping excess capital available when opportunities arise. They reduce the likelihood of forced risk reductions and allow processes to continue through adverse environments. In this sense, drawdown control is a mechanism for protecting the compounding engine, not merely a comfort preference.
What Drawdowns Reveal That Volatility Does Not
Volatility measures dispersion around a mean, not the shape or clustering of losses. Drawdowns are explicitly directional and path dependent. They summarize the worst realized losses from peaks and the recoveries afterward. A portfolio can have low volatility yet experience occasional abrupt losses due to nonlinear exposures, liquidity gaps, or correlation spikes. Drawdown analysis is particularly helpful for strategies with asymmetric payoffs, such as option selling or carry trades, where losses tend to arrive in bursts.
Drawdowns also link directly to practical constraints. Volatility can remain contained while mark-to-market losses trigger margin calls or mandate violations. In contrast, drawdown metrics translate directly into the equity buffer that supports ongoing operations.
Common Misconceptions and Pitfalls
Several misunderstandings distort how drawdowns are interpreted and used.
- Max drawdown alone is sufficient. Maximum drawdown is a single worst episode. Without average depth, duration, and frequency, it provides an incomplete view. One large historical event may not reflect typical stress, and conversely, a quiet backtest can hide vulnerability to rare but plausible shocks.
- Historical drawdown equals future risk. Markets are nonstationary. Structural breaks, regime changes, and evolving correlations mean the worst past event is not a cap on future losses. Stress testing and scenario analysis complement historical statistics for this reason.
- Sharpe ratio covers the same ground. A high Sharpe ratio does not guarantee shallow drawdowns, especially for strategies with skewed or fat-tailed returns. Drawdown metrics add information that variance-based measures omit.
- Stop-loss rules eliminate drawdowns. Stops convert large open losses into realized losses, but they do not remove path risk and can create whipsaw that lengthens time under water. Moreover, gap risk and liquidity shortfalls can lead to exits beyond stop levels.
- Percentage is all that matters. Two accounts with identical percentage drawdowns can have very different operational consequences if one is levered or subject to tighter margin terms. The same percentage loss can be survivable for one process and existential for another.
- Overfitting to minimize historical drawdowns is harmless. Tuning parameters to reduce past drawdowns can degrade robustness. Apparent improvements often arise from chance alignments with historical noise. Out-of-sample validation and economically grounded reasoning are necessary to assess whether reduced drawdowns reflect genuine risk control.
- Diversification guarantees drawdown control. Diversification helps when correlations are low or stable. During stress, correlations often rise, reducing diversification benefits precisely when needed. Drawdown analysis during crisis windows tests whether diversification persists when it matters.
Interpreting Drawdowns Across Leverage and Liquidity
Drawdown statistics must be interpreted through the lens of leverage and liquidity. Leverage magnifies both returns and losses. A strategy with seemingly acceptable drawdowns at low leverage can become fragile if scaled without accounting for higher margin requirements or liquidity impact. In addition, liquidity can vanish in stress. Model-based drawdowns that assume continuous pricing and frictionless execution can understate realized losses when exits occur through gaps or wide spreads.
Risk managers often adjust drawdown assessments with liquidity haircuts or stress scenarios that widen slippage and compress exits. The result is an estimate of path outcomes under more realistic trading conditions. While no estimate is perfect, acknowledging liquidity as part of drawdown dynamics improves decision quality.
How Drawdown Awareness Guides Control Frameworks
Understanding drawdowns informs the structure of risk controls, even without prescribing specific trades. Several control elements align with drawdown awareness:
- Position sizing and exposure limits: sizing based on risk, not nominal capital, is designed to keep typical drawdowns within tolerable ranges. Exposure caps, both gross and net, limit directional concentration that can deepen drawdowns.
- Volatility and correlation sensitivity: adjusting exposure when realized volatility or cross-asset correlations rise can limit clustering of losses. The objective is to prevent a small drawdown from accelerating into a deep one during regime shifts.
- Leverage and margin buffers: maintaining headroom to margin calls reduces the chance that a drawdown triggers forced deleveraging. Buffers are a core element of survivability planning.
- Liquidity-aware execution: recognizing that liquidity declines in stress, risk frameworks incorporate assumptions about slippage and market depth to estimate drawdowns more realistically.
- Scenario and stress testing: applying historical and hypothetical shocks tests whether the process remains viable if a drawdown similar to past crises occurs, or if a new pattern of stress emerges.
These elements translate drawdown understanding into operational safeguards. They are not recommendations, but rather illustrations of how risk control frameworks reflect the realities that drawdowns reveal.
Comparing Strategies Through a Drawdown Lens
Investors and risk committees often face trade-offs between average return and drawdown profile. Consider two strategies over ten years. Strategy A compounds at 14 percent with a 35 percent maximum drawdown and a median duration of 8 months. Strategy B compounds at 10 percent with a 15 percent maximum drawdown and a median duration of 3 months. The choice depends on mandate constraints, tolerance for time under water, and the risk of forced de-risking during stress. The drawdown lens converts abstract tolerance into concrete expectations about depth and time.
Another comparison involves recovery slope. Suppose two strategies both suffer a 20 percent drawdown. One recovers within 2 months with a sharp rebound. The other recovers over 12 months with a slow grind. The same depth masks different operational consequences. The slow recovery ties up capital and invites error induced by impatience. Duration, in other words, is not a mere footnote.
The Mathematics of Recovery and Ruin
Drawdowns connect to probability of ruin. Probability of ruin refers to the chance that cumulative losses hit a level that forces exit or prohibits further trading. While closed-form results depend on assumptions, the qualitative message is stable. As loss size and volatility rise relative to buffer capital, the probability of ruin increases. Using simple arithmetic, a series of independent returns with negative skew or fat tails increases the chance of extreme losses relative to a normal model. Drawdown statistics capture realized proximity to ruin thresholds and help calibrate whether buffers are adequate.
Recovery math is equally informative. If W is wealth and r is period return, then over n periods W evolves as W × Π(1 + r_i). A drawdown reduces the base on which future returns compound. Preventing large drawdowns protects the compounding base, which has a disproportionate effect on terminal wealth. This is a mechanical property of multiplicative processes, not a psychological bias.
Behavioral Dimensions of Drawdowns
Even well-designed processes can falter if participants cannot live with the equity curve. Drawdowns trigger loss aversion, narrowing focus on recent losses and exaggerating perceived risk. Decision quality declines when attention shifts from process quality to short-term pain relief. Clear expectations, documented risk budgets, and transparent communication about drawdown behavior help align participants with the path they are likely to experience.
Behavior does not change the math, but it determines whether the math has a chance to work over time. A process that recognizes its typical drawdowns and maintains adherence during those periods has a higher chance of realizing its statistical edge.
Using Historical Data Without Overconfidence
Historical drawdowns are informative but incomplete. Samples often exclude failed strategies, creating survivorship bias. Backtests that choose parameters after viewing outcomes embed look-ahead bias. Market structure evolves. Liquidity, transaction costs, and microstructure change, altering path properties. Interpreting drawdowns responsibly means stating measurement windows, acknowledging biases, and using out-of-sample periods where possible.
Rolling window analysis helps. Rather than quoting a single maximum drawdown since inception, one can examine the distribution of max drawdowns across overlapping subperiods. If most windows exhibit shallow drawdowns and quick recoveries, confidence in the stability of the profile increases. If outcomes vary widely by window, then the drawdown characteristics are less stable than a single long-term number suggests.
Capital Preservation and Long-Term Survivability
Capital preservation is not only about avoiding large losses. It is about sustaining the process across regimes and shocks so that the statistical properties of the edge can manifest over time. Drawdown control supports that objective by keeping losses within a range that avoids forced exits and maintains operational flexibility. Smaller and shorter drawdowns preserve dry powder for future opportunities, reduce the likelihood of breaching constraints, and improve adherence to the process.
Survivability is the precondition for compounding. The more time a strategy spends alive and in risk, the more chances it has to realize its expected return. Drawdowns are the principal threat to survivability because they directly consume capital and can trigger constraints that end or interrupt the process. Monitoring, understanding, and planning for drawdowns is therefore central to any risk management framework that values longevity.
Applying Drawdown Insight in Practice
Risk management based on drawdown insight is a matter of alignment. It aligns sizing and exposure with the level of pain and constraint the process can withstand. It aligns liquidity assumptions with real execution conditions during stress. It aligns expectations with the statistical range of outcomes rather than with a single point estimate.
In practice, teams often establish risk budgets in terms of acceptable drawdown depth and duration, monitor underwater charts to contextualize ongoing losses, and perform stress tests that simulate clustered losses and elevated correlations. They evaluate whether buffers to margin, mandate limits, and cash needs remain sufficient if a drawdown similar to historical crises were to occur. They also study whether past recoveries depended on conditions that may not repeat, such as rapid central bank interventions or unusually strong rebounds in specific sectors.
Reading Drawdown Reports Critically
When reviewing performance materials, a few diagnostic questions improve interpretation without venturing into recommendations:
- Over what window were maximum and average drawdowns measured, and does the window include multiple cycles and crisis periods
- How were drawdown durations computed, and are recoveries defined by end-of-day closes or intraday highs
- Are drawdown metrics presented alongside leverage, margin usage, and liquidity assumptions, or are they framed as leverage invariant
- How sensitive are drawdown statistics to modest changes in parameters or to the inclusion of different start dates
- Do stress tests and scenario analyses produce drawdowns that are consistent with the historical metrics, or do they reveal vulnerabilities not visible in the sample
These questions reframe drawdown metrics as part of a broader narrative about path risk, rather than as isolated numbers to be memorized.
Why Drawdowns Matter
Drawdowns matter because they provide a direct measure of path risk, which is the risk that compounding is interrupted, capital is impaired, or constraints are breached before a process can realize its expected outcomes. They connect arithmetic truths about multiplicative returns with operational realities such as margin, liquidity, and behavior. By focusing on drawdowns, risk managers preserve the conditions necessary for strategies to survive and function over the long term.
Key Takeaways
- Drawdowns capture both the depth and duration of losses from prior peaks, which determine the lived experience of a strategy more than average returns do.
- Losses are asymmetric for compounding, so limiting drawdown depth protects the base on which future gains accumulate.
- Operational constraints such as margin, mandates, and liquidity turn drawdowns into survivability questions, not just comfort preferences.
- Maximum drawdown alone is incomplete; duration, frequency, recovery slope, and liquidity context are essential for interpretation.
- Historical drawdowns inform expectations but do not cap future risk; stress testing and realistic assumptions about correlation and liquidity are necessary complements.