Correlation sits at the center of portfolio risk management because it governs how positions move together. When traders think in terms of single trades, risk can appear isolated. Once positions are combined, correlations reveal how those risks interact. Understanding positive and negative correlation helps prevent unintended concentration, reduces the chance of compounding losses, and supports long-term survivability of capital across market regimes.
Defining Positive and Negative Correlation
Correlation measures the strength and direction of a linear relationship between two return series. It is bounded between -1 and +1.
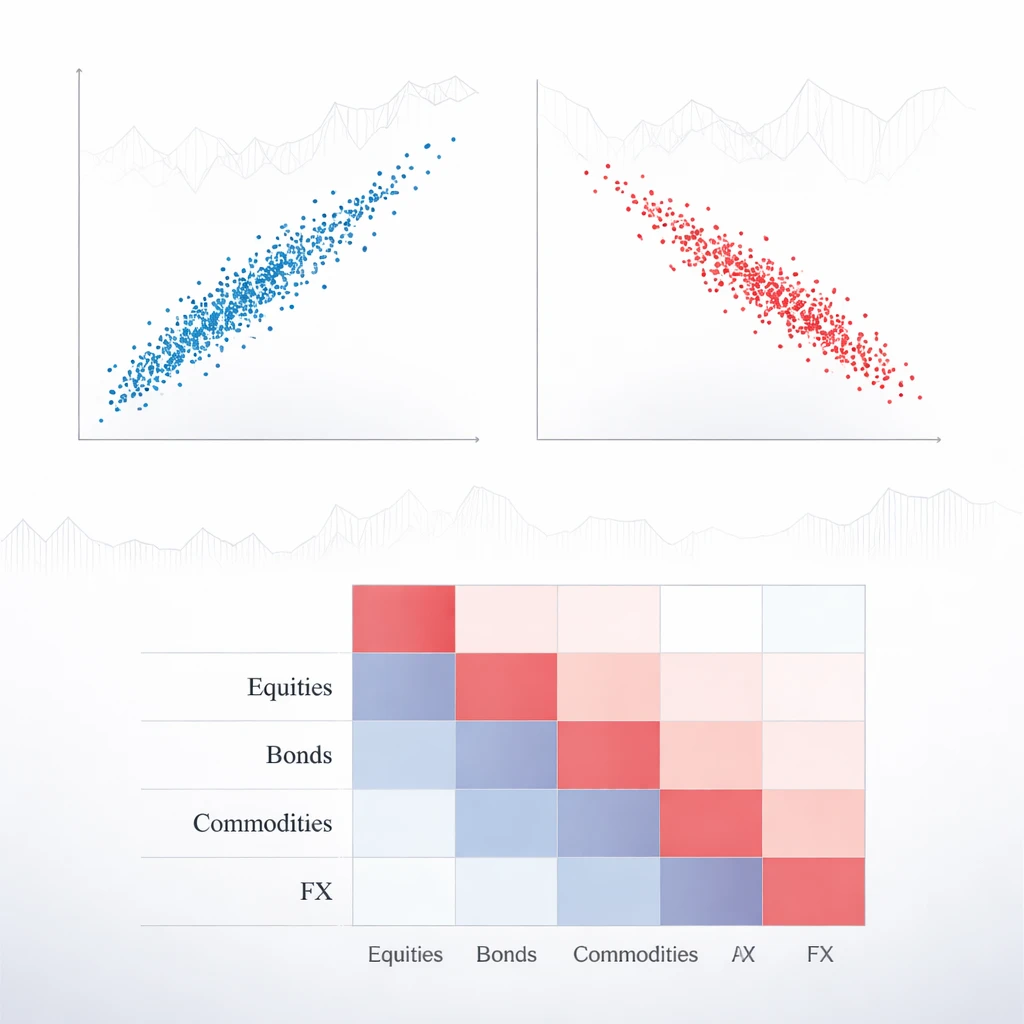
- Positive correlation: returns tend to move in the same direction. If one asset’s return is above its average, the other is likely to be above its average at the same time.
- Negative correlation: returns tend to move in opposite directions. If one asset’s return is above its average, the other is likely to be below its average.
- Zero correlation: there is no linear tendency for returns to move together. Movements may still be related through nonlinear patterns, but linear correlation will not capture it.
In practice, correlations among risky assets are rarely close to +1 or -1 for long periods. They are dynamic and vary across market regimes, volatility states, and macroeconomic conditions. A reading of +0.6 means returns often co-move in the same direction, but not perfectly. A reading of -0.4 means returns often move in opposite directions, but with variability.
Correlation, Covariance, and Beta
Correlation is a normalized form of covariance. While covariance captures the raw co-movement in units of return squared, correlation scales it by the individual volatilities. This normalization makes correlation a convenient, dimensionless measure for comparisons across assets.
Beta is a related concept that measures the sensitivity of an asset to a chosen reference, often a market index. If an asset has a beta of -0.5 to the market, it tends to move opposite the market, on average by half the magnitude, assuming a stable relationship. Correlation enters the beta calculation indirectly through the covariance between the asset and the reference. However, two assets can have the same beta to a market and different correlations to each other, and vice versa. Correlation is pairwise and symmetric, whereas beta is defined with respect to a specific reference.
Why Correlation Matters for Risk Control
Risk management focuses on the distribution of portfolio outcomes, not the behavior of individual trades. Correlation alters that distribution. When positions are positively correlated, losses tend to arrive together. When positions are negatively correlated, gains in one position can offset losses in another, reducing drawdowns and smoothing variability.
Consider two positions with the same daily volatility of 1 percent and equal capital weights. If their correlation is +0.9, the combined daily volatility is approximately 1.20 percent. If correlation is zero, the combined volatility is roughly 1.00 percent. If correlation is -0.5, the combined volatility falls to about 0.87 percent. The reduction is material because the cross terms in the portfolio variance adjust with correlation. Lower correlation reduces the tendency for losses to cluster, which can protect capital during adverse sequences.
Correlation therefore influences:
- Drawdown behavior: positively correlated positions can deepen drawdowns, while negative correlation can slow or limit them.
- Leverage tolerance: portfolios with highly correlated positions typically tolerate less leverage compared to more diversified ones with the same individual volatilities.
- Capital survivability: during stress, correlations often rise among risky assets, which can accelerate capital erosion if the portfolio construction assumed stable, low correlations.
Applying Correlation in Real Trading Scenarios
Cross-Asset Relationships
Cross-asset correlations vary with regime. For example, government bond returns and equity returns have often shown mild negative correlation in certain deflation-aware periods, which can dilute portfolio risk. In inflationary or tightening cycles, that correlation can move toward zero or even become positive. A trader holding both a broad equity exposure and a duration exposure is managing not only two assets but also a relationship that can shift with macro data, central bank policy, and inflation expectations.
Sector and Factor Clustering
Within equities, correlations tend to cluster by sector, country, and factor exposures such as value, growth, size, and momentum. Four positions in the same industry are often more correlated to each other than to the broad market. A portfolio that appears diversified by name may still be concentrated by factor. The protective effect of diversification is reduced when seemingly distinct positions share the same drivers.
FX, Commodities, and Cryptocurrencies
Foreign exchange pairs can display strong correlations due to shared exposure to the US dollar or to global risk sentiment. Commodities may correlate through shared supply shocks or energy input costs. In digital assets, individual coins often exhibit high correlation during market stress, reflecting shared liquidity and sentiment. A portfolio spread across many coins can still behave like a single position if correlations are high in adverse periods.
Long and Short Exposures
Long and short positions modify correlation effects. If a long position is paired with a short position in a highly correlated asset, the net portfolio may reduce exposure to the common driver. However, any mismatch in fundamentals or idiosyncratic events can create basis risk. The pair can amplify volatility if the correlation weakens when it matters most. For example, a long in an airline operator and a short in crude oil could offset risks tied to fuel costs, yet other variables such as demand shocks, labor costs, or regulatory events can dominate outcomes.
Derivatives and Hidden Correlations
Options introduce sensitivity to volatility and skew. Consider a covered call: long the underlying and short a call option. Price risk is reduced relative to a pure long, but exposure to implied volatility remains. In equity markets, volatility typically rises when prices fall. The short option can lose value at the same time the underlying declines. The negative correlation between prices and volatility can therefore reduce the protective effect the position seemed to offer. The joint behavior of price and volatility is a correlation structure, not just a single asset risk.
Correlation Is Dynamic, Not Fixed
Correlations evolve. They respond to macro shocks, policy changes, liquidity conditions, and investor positioning. Assuming correlations are stable is a common source of underestimation of tail risk.
- Regime dependence: correlations among risky assets often rise during market downturns as investors de-risk simultaneously.
- Volatility state: in calm markets, estimated correlations can appear low due to muted co-movements. In high volatility states, apparent linkages strengthen.
- Structural breaks: changes in regulation, market structure, or policy frameworks can shift relationships for long periods.
Risk managers sometimes study correlations not only on average daily returns but also in downside tails. Two assets might show low correlation on average yet exhibit strong positive co-movement during large selloffs. This tail correlation drives drawdown risk. Linear correlation is not designed to capture nonlinear dependence or tail clustering. Additional tools, such as rank correlations and tail event analysis, complement the picture.
Estimating Correlation: Practical Considerations
Estimating correlation is a data exercise with choices and trade-offs.
Lookback Window and Frequency
Shorter windows respond quickly to new information but increase noise. Longer windows stabilize estimates but can blur regime shifts. Daily data often suits portfolio-level monitoring. Intra-day data can capture short-horizon effects such as microstructure noise and intraday common factors, but requires careful cleaning.
Pearson vs Rank-Based Measures
The Pearson correlation is the standard measure for linear relationships. When distributions are skewed or heavy-tailed, rank-based measures such as Spearman can provide robustness to outliers. Using both can reveal whether extreme observations are dominating the estimate.
Non-Synchronous Trading and Time Zones
Assets that trade in different time zones can produce biased correlations if returns are measured over mismatched intervals. Aligning windows or using overlapping intervals can mitigate the effect. For example, comparing a US equity close-to-close return to a European equity close-to-close return may overlook information released between the two closes.
Data Cleansing and Corporate Actions
Spurious price spikes, stale quotes, and unadjusted corporate actions can distort correlation. Basic checks for outliers, missing data handling, and proper adjustment for dividends and splits improve reliability. The same logic applies to futures rolls and options series continuity.
Rolling Estimates and Stability Checks
Plotting rolling correlations offers a visual sense of stability. Large swings suggest regime dependence. Comparing rolling estimates across multiple window lengths helps determine whether a perceived relationship is persistent or transient. Stability checks are essential before treating a measured correlation as a robust source of diversification.
Tail Dependence and Stress Testing
Linear correlation underestimates dependence during extremes when distributions are skewed or when common constraints bind. Supplementing correlation with stress scenarios, drawdown co-movements, and conditional measures can reveal relationships that only emerge under stress. Even a simple exercise of examining joint performance during the worst 5 percent of market days is informative.
Exposure: Aggregation Beyond the Position Count
The number of positions says little about diversification. Exposure should be aggregated by risk. Correlation determines how those exposures interact.
Volatility Weighting and Risk Contribution
Positions with different volatilities contribute unevenly to portfolio risk. A small capital allocation to a very volatile asset can dominate the overall variance. Correlation determines the cross terms. Equal capital weights rarely mean equal risk contribution. Many risk frameworks express position size in volatility terms, then adjust for correlations through a correlation matrix in the portfolio variance calculation.
Factor and Macro Exposures
Exposure is not only to individual symbols. It also reflects common drivers. A set of positions may share sensitivity to interest rates, inflation, credit spreads, or equity market beta. Two trades in different asset classes can still be strongly positively correlated if they load on the same macro factor. A long high yield bond and a long cyclical equity, for example, can both be sensitive to growth and liquidity conditions. Recognizing these factor linkages prevents the illusion of diversification.
Currency Effects
Owning a foreign asset creates a currency exposure unless returns are measured in local terms or currency movements are neutralized. The correlation between the asset and its currency can amplify or offset the total return in the trader’s base currency. Currency correlations can shift quickly with policy, trade balances, and risk sentiment.
Liquidity and Funding Channels
During stress, correlations can rise through liquidity and funding effects even if fundamentals are unrelated. Forced deleveraging and margin calls lead to asset sales that are not based on value, making diverse assets fall together. These correlations can be state-dependent and temporarily extreme, yet they matter most for capital preservation.
Misconceptions and Pitfalls
“Negative Correlation Guarantees a Hedge”
Negative correlation does not guarantee offsetting performance when you need it. The correlation of average returns can differ from the correlation of large drawdowns. State dependence, changing volatility, and nonlinear payoffs can erode the protective effect just when it is most valuable.
“Zero Correlation Means Independence”
Zero linear correlation does not imply independence. Nonlinear relationships can exist even when the linear coefficient is near zero. For example, two assets might move together mostly during extremes but remain unrelated in normal times. Linear correlation would miss this dependence.
“More Names Equal Diversification”
Adding positions that are strongly positively correlated to your existing holdings may not reduce risk and can increase it. Diversification depends on correlation and relative volatility, not on the number of tickers.
“Historical Correlation Will Persist”
Correlation estimates can be fragile. Market structure changes, policy shifts, and crowding can alter relationships. Overreliance on a single historical sample can lead to underestimation of future co-movement.
“Hedged Positions Eliminate Risk”
Hedges often rely on proxies. A short position may not perfectly offset a long because the relationship relies on an assumed correlation that can vary. Basis risk arises when the hedge instrument and the underlying do not move as expected due to different fundamentals, liquidity, or technical flows.
“Correlation Is Only About Prices”
Correlation among risk drivers matters as much as price correlation. Volatility, liquidity, and funding conditions can become correlated. If multiple risk drivers deteriorate at once, losses can compound even if assets do not show extreme price co-movement in normal periods.
Illustrative Examples
Equities and Rates
Equity and sovereign bond correlations have not been stable across decades. There have been periods when bonds provided a negative correlation to equities, softening portfolio drawdowns during equity declines. There have also been periods when both fell together due to inflation shocks or policy repricing. A portfolio that assumed a constant negative correlation would overstate diversification.
Same Sector, Different Names
Consider four companies in the same industry group. Each position appears distinct, yet earnings cycles, regulatory changes, and investor flows can create high positive correlation among them. During sector-specific stress, all four can decline together. The portfolio behaves as if it had a single concentrated exposure.
FX Pairs and the Dollar
Pairs that include the same base currency can show strong relationships due to shared dollar dynamics. A portfolio with multiple dollar-based pairs can be more correlated than it appears. When the dollar strengthens broadly, the positions can move in tandem, increasing aggregate risk.
Commodities and Supply Chains
Certain commodities can correlate through common inputs. For instance, energy prices can influence metals and agricultural costs through transportation and processing. A portfolio holding several commodities can be exposed to the same energy factor, leading to positive correlation during energy shocks.
Digital Assets
During calm periods, some coins differentiate based on network-specific news. During broad de-risking, correlations often rise across the complex, and liquidity conditions dominate. Risk dispersion shrinks exactly when it is most needed.
Options and Volatility
A trader who is long an index and short a call option reduces near-term upside and collects option premium. If the market falls and implied volatility rises, the short option can lose additional value due to vega exposure even while the index declines. The negative correlation between price and volatility becomes a second channel for losses. The position’s total risk depends on both relationships.
From Correlation to Portfolio Construction
Correlation guides how exposures combine, which feeds into position sizing and concentration limits. While risk frameworks vary, several practices are common in institutional settings:
- Correlation-aware sizing: risk budgets are often allocated with attention to the correlation matrix so that adding a new position reflects how it changes portfolio variance rather than just its standalone volatility.
- Group risk limits: exposures are often limited by clusters, such as sector, factor, or macro theme, acknowledging that assets within a cluster can become highly correlated in stress.
- Rolling diagnostics: correlation and beta are monitored through time with rolling windows, complemented by stress tests and tail co-movement analysis.
- Scenario overlays: historical and hypothetical scenarios are used to evaluate whether assumed negative correlations hold during shocks.
Numerical illustrations clarify the magnitude of correlation effects. Take two positions with the same volatility and equal weights. With a correlation near +1, the combined risk approaches that of a single position. With a correlation near -1, the combined risk can become very small, though this extreme is rare and fragile. Most practical improvements come from moving correlations from high positive to moderate or low positive, or from mildly positive to mildly negative. Small changes in correlation can meaningfully alter portfolio variance when positions are material in size.
Monitoring and Adapting to Correlation Changes
Because correlations evolve, ongoing measurement matters. Frequent recalibration can be noisy, but ignoring change can be costly. Sensible approaches include using multiple estimators, comparing across time horizons, and incorporating qualitative information about regime shifts. When policy backdrops change, or when market leadership rotates, historical correlation matrices can become stale. Many risk teams therefore triangulate between statistics, economic reasoning, and scenario analysis rather than relying on a single number.
It is also helpful to distinguish between short-horizon and long-horizon correlations. Short-horizon relationships can be driven by liquidity, microstructure, or transient flows. Long-horizon relationships can reflect macroeconomic co-movement and value cycles. A position that offsets risk intraday may not offset risk over months, and vice versa. Matching the measurement horizon to the decision horizon is a practical requirement for meaningful correlation estimates.
Correlation and Long-Term Survivability
Protecting trading capital over long horizons depends on managing the clustering of losses. Positive correlation makes clusters more likely. Negative correlation, when reliable, can reduce clustering and support smoother equity curves. The central challenge is that relationships change, and the most attractive diversifiers in one regime can weaken in another. Long-term survivability therefore benefits from a disciplined assessment of how correlations behave across stress events, not just during average conditions.
A useful mindset is to treat correlation as a hypothesis that can be tested and updated. Monitor whether a presumed diversifier continues to offset risk under pressure. Examine how much of portfolio variance comes from common factors, and how much from independent sources. When common factors dominate, the margin for error shrinks. Losses from correlated exposures compound faster than intuition suggests, especially with leverage.
Common Analytical Checks
Several checks help maintain perspective on correlation and exposure without implying specific actions:
- Compare correlations of returns to correlations of drawdowns to detect tail co-movement.
- Review rolling correlations across multiple windows to balance responsiveness and stability.
- Cross-check Pearson with rank-based correlations to reduce sensitivity to outliers.
- Segment exposures by factor and cluster correlations to avoid hidden concentration.
- Run historical stress scenarios to see how relationships behaved when liquidity was scarce.
Conclusion
Positive and negative correlation are foundational to how risks combine inside a portfolio. Positive correlation concentrates risk and can accelerate drawdowns. Negative correlation, when genuine and persistent, can dampen portfolio volatility and reduce the severity of loss clusters. Because correlations shift with regimes, volatility states, and liquidity, their estimation and ongoing monitoring are central to protecting capital and maintaining long-term viability. Effective risk management treats correlation as a dynamic property and focuses on exposure at the level of risk drivers, not just position counts.
Key Takeaways
- Correlation measures how returns move together and directly shapes portfolio variance and drawdown behavior.
- Apparent diversification by name can mask concentration when positions share factors, liquidity, or macro drivers.
- Correlations change across regimes and often rise in stress, so historical estimates can overstate diversification.
- Linear correlation may miss tail dependence and nonlinear relationships, calling for complementary diagnostics.
- Managing exposure with correlation-aware risk aggregation supports capital preservation and long-term survivability.