Drawdowns are the lived experience of portfolio risk. A drawdown is the decline in value from a prior peak to a subsequent trough, measured as a percentage. Portfolio drawdown management is the systematic process of measuring, monitoring, and shaping a portfolio’s path of losses and recoveries so that the depth, duration, and frequency of declines remain consistent with long-term objectives and constraints. It complements traditional risk measures such as volatility by focusing on the path-dependence that investors actually face.
Effective management of drawdowns is central to building resilient portfolios. Long-horizon capital plans, such as retirement spending, endowment distributions, or multi-decade wealth accumulation, depend not only on average returns but also on the timing and severity of losses. A sustained decline can force unwelcome decisions, such as selling assets to meet liabilities at unfavorable prices, which can damage compounding. The portfolio construction choices that determine correlation structures, liquidity, and position sizes are therefore inseparable from drawdown outcomes.
What Is Portfolio Drawdown Management?
Portfolio drawdown management encompasses a set of measurement practices, governance thresholds, and design choices aimed at limiting adverse paths. The objective is not to avoid losses altogether. Rather, it is to understand the distribution of potential losses and to align portfolio characteristics with the capacity to withstand them.
In practice, this involves clear definitions of risk metrics, disciplined monitoring, and a documented approach to allocation, rebalancing, and liquidity that accounts for stress scenarios. The focus is on the portfolio as a whole, not isolated positions. Managing one position’s downside without considering correlation effects can create a false sense of security if portfolio-level drawdowns remain large when assets decline together.
Measuring Drawdowns
Measurement precedes management. Several complementary statistics help describe the shape of drawdowns across time.
Depth, Duration, and Recovery
Maximum drawdown is the largest peak-to-trough decline over a specified period. It is a useful worst-case summary but depends heavily on the window chosen. A portfolio may show a modest maximum drawdown over a short window while having experienced a much larger decline over a longer horizon.
Average drawdown and median drawdown characterize typical declines rather than the single worst observation. They are informative for understanding everyday risk, not just extreme outcomes.
Drawdown duration measures how long the portfolio remains below a prior peak. Long recoveries can be more challenging for planning than a sharp but brief decline, especially when ongoing spending or liability payments are required.
Recovery time is the number of periods between the trough and a new high-water mark. An extended recovery increases the chance of behavioral or funding pressures.
Ulcer Index and related drawdown-based metrics emphasize the persistence and severity of underwater periods. Unlike volatility, which penalizes upside and downside symmetrically, drawdown-based measures focus on declines below a peak.
It is often helpful to pair drawdown metrics with volatility, skewness, and tail measures. A portfolio can have moderate volatility yet experience severe drawdowns if returns cluster negatively or correlations spike during stress.
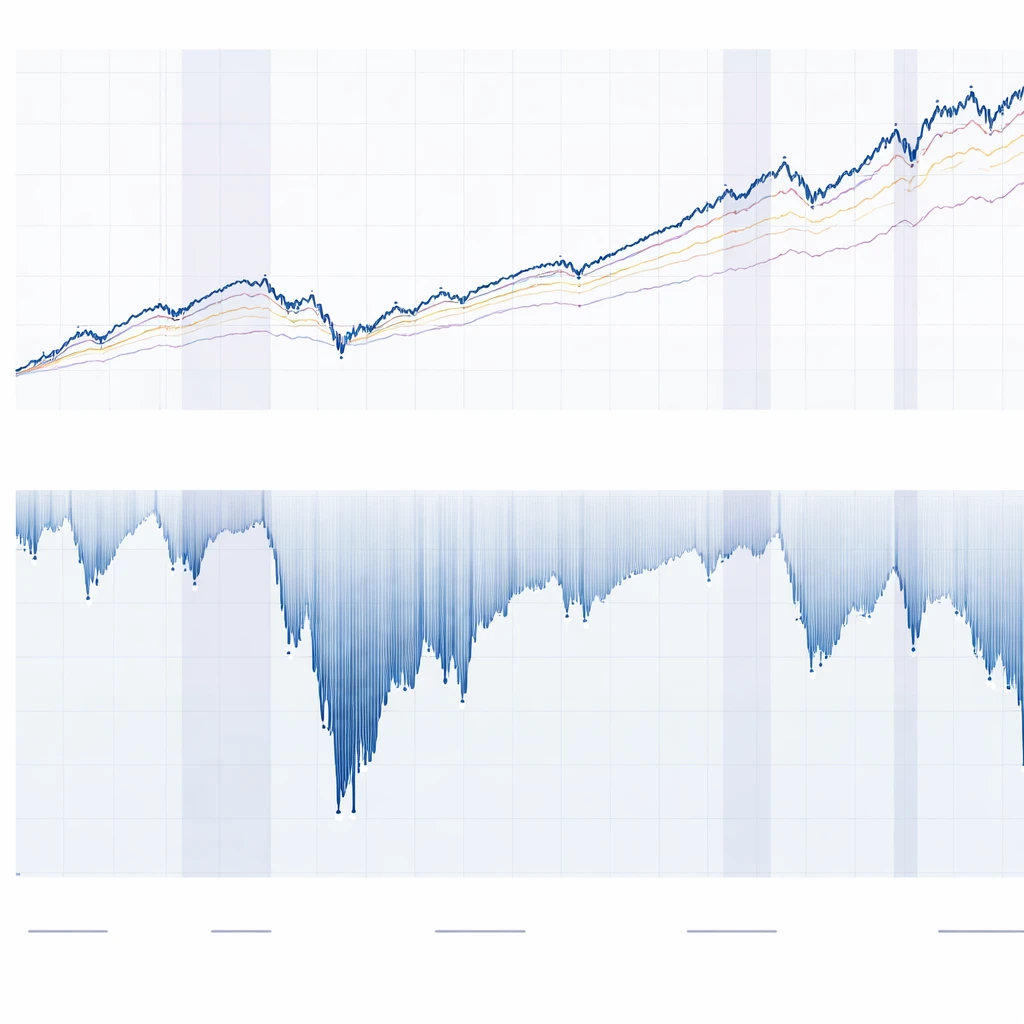
Underwater Curves and Path Dependence
An underwater curve plots the percentage drawdown from the most recent peak at each point in time. This visualization reveals the rhythm of loss and recovery. Two portfolios with the same long-run return and volatility can feel very different when one spends extended periods near prior highs and the other spends years underwater. The latter may be unacceptable for capital plans that rely on predictable funding.
Drawdowns are path-dependent. A 30 percent loss requires roughly a 42.9 percent gain to recover to the previous peak because the base has shrunk. Large losses compound the recovery challenge: a 50 percent decline needs a 100 percent gain to break even. Portfolio construction that limits large peak-to-trough moves can therefore protect the compounding process even if average returns are unchanged.
Why Drawdown Management Matters for Long-term Capital Planning
Long-horizon investors often plan against spending, liquidity, or regulatory constraints. Drawdown management supports these plans in three ways.
Preservation of compounding. The arithmetic of losses is asymmetric. Avoiding deep drawdowns reduces the time and return required to recover, which can materially improve terminal wealth under realistic sequences of returns.
Sustainability of spending or distributions. Portfolios that fund ongoing cash flows are exposed to sequence risk. Withdrawals during a drawdown permanently remove capital, slowing recovery. Understanding expected drawdown depth and duration helps calibrate spending rates and reserve buffers.
Organizational and behavioral resilience. Prolonged underwater periods increase the likelihood of forced de-risking, governance changes, or behavioral errors. Clear drawdown expectations and monitoring reduce the chance that adverse conditions trigger unplanned portfolio changes.
Economic and Behavioral Drivers of Drawdowns
Drawdowns arise when returns are negative and correlations change in unfavorable ways. Several forces tend to intensify declines at the portfolio level.
Correlation convergence in stress. Assets that appear diversified in normal periods can become more correlated during market stress. For example, equities across regions may decline together during global recessions, and credit spreads may widen simultaneously with equity selloffs.
Liquidity amplification. A need for cash during a downturn can force sales into a falling market. Liquidity premiums can widen, and transaction costs can rise. Portfolios that appear liquid at mid quotes may realize larger losses when liquidation is required.
Leverage and financing conditions. Borrowed exposures can accelerate drawdowns when asset values fall. Margin calls or covenant constraints can force deleveraging at adverse prices, deepening losses.
Behavioral pressures. Drawdowns increase anxiety and can lead to timing mistakes. Even well-designed portfolios can falter if loss aversion leads to unplanned changes near troughs. Clear ex ante expectations and governance help mitigate this risk.
Portfolio-level Design Levers
Portfolio drawdown management operates primarily through structural design choices. The goal is to influence the distribution of potential drawdowns before stress arrives.
Diversification across assets and risk factors
Diversification is most effective when exposures respond differently to key economic drivers such as growth and inflation. Holding assets that rely on distinct cash flow sources or risk premia can reduce the likelihood of simultaneous losses. Diversification across geographies, sectors, and styles can help, but correlations within these groups often rise in global downturns.
Risk factor thinking provides a common language for diversification. For example, equity risk, duration risk, credit risk, inflation sensitivity, and currency risk may explain much of a portfolio’s variation. Allocations that disperse exposure across several independent drivers can reduce peak-to-trough losses compared with portfolios concentrated in a single dominant factor.
Allocation sizing and risk budgeting
Position sizes influence drawdown depth more than any other controllable variable. A risk budget articulates how much contribution to overall variance or drawdown each asset or sleeve is expected to provide. The same expected return can be achieved with different drawdown profiles depending on how concentration is managed.
Leverage is a design choice that deserves careful scrutiny. Borrowing to scale positions can leave drawdown depth unchanged in proportional terms but increase the risk of breaching financing constraints during stress. Risk budgeting frameworks often account for both statistical risk and funding risk when sizing allocations.
Rebalancing discipline
Rebalancing policies influence both the experience of drawdowns and the speed of recovery. Mean-reverting markets may reward periodic rebalancing that trims winners and adds to losers. Trending markets can penalize the same policy by adding to positions as they decline. The effect is path-dependent and sensitive to frequency, thresholds, and transaction costs.
From a drawdown perspective, disciplined rebalancing can limit concentration that builds during rallies, thereby containing subsequent losses. It can also maintain diversification when some assets fall and others rise. The chosen rules should reflect the liquidity profile of the portfolio and the tolerance for interim tracking error relative to policy weights.
Liquidity and cash buffers
Liquidity supports drawdown management by preventing forced sales and enabling rebalancing in stress. Cash or near-cash holdings can serve as a buffer for capital calls, spending needs, or collateral requirements. The amount of liquidity needed depends on the volatility of liabilities, the breadth of rebalancing activity in stress, and the stability of financing lines.
Illiquid assets can be valuable for long-horizon goals, yet they introduce unique drawdown considerations. Reported valuations for private assets may be smoothed relative to public markets, which delays recognition of drawdowns. This smoothing can mask underlying economic losses and compress measured drawdown statistics, complicating risk assessment and capital planning.
Tail risk mitigants and overlays
Portfolios sometimes employ overlays that seek to reduce large drawdowns, such as dynamic volatility control, explicit downside protection, or allocations to assets that historically benefited during equity selloffs. These approaches vary widely in cost, reliability, and basis risk. Their effectiveness depends on market regime, implementation details, and the degree to which the chosen mitigant responds to the same shock affecting the core portfolio.
Any overlay should be evaluated through the lens of total portfolio outcomes. A tool that reduces the worst 5 percent of outcomes at high cost in benign periods may still be useful for plans that cannot tolerate severe drawdowns. Others may prefer to accept larger drawdowns in exchange for lower long-run drag. The key is to align the design choice with the actual tolerance for depth and duration of loss.
Scenario Analysis, Stress Testing, and Regime Awareness
Anticipating how a portfolio behaves under stress requires both historical and hypothetical analysis.
Historical scenarios. Examining performance during past episodes, such as global recessions, inflation shocks, or liquidity crises, provides tangible evidence of path behavior. It also reveals correlation changes. The limitation is that the next crisis may differ from the past, and structural changes in markets can make comparisons imperfect.
Hypothetical shocks. Constructing shocks to growth, inflation, rates, credit spreads, or currencies allows examination beyond what is in the historical record. These scenarios can be simple, such as a parallel yield curve shift, or complex, such as a combination of equity drawdown, volatility spike, and widening funding spreads.
Monte Carlo paths. Simulated return paths produce distributions of drawdown depth and duration under assumptions about volatility, correlation, and tail behavior. Fat-tailed distributions and time-varying correlations provide more realistic stress outcomes than normal assumptions. The quality of the result depends on the realism of the inputs.
Regime awareness. Drawdown statistics are not stationary. Inflation regimes, monetary policy frameworks, and market microstructure evolve. For example, many diversified stock-bond portfolios experienced an unusual simultaneous drawdown when both equities and high-quality bonds declined together in 2022, reflecting a shock to inflation and rates. A robust program considers multiple regimes rather than relying on a single average.
Monitoring, Governance, and Policy Rules
Drawdown management requires a monitoring and governance framework that is aligned with the portfolio’s purpose.
Risk dashboards. Regular reporting of underwater curves, drawdown depth and duration, and contributions by asset and factor provides a shared understanding of the current state. Visualizing both the absolute drawdown and the drawdown relative to a policy benchmark helps distinguish portfolio design effects from market-wide conditions.
Thresholds and triggers. Some organizations define drawdown control bands, such as early-warning thresholds and maximum tolerances. Crossing a threshold may prompt a formal review, an attribution analysis, and confirmation that liquidity and financing remain adequate. The existence of thresholds does not dictate trading responses. It supports disciplined decision-making under stress.
Data integrity and timeliness. Accurate, timely position and price data are prerequisites. Stale or model-based prices for illiquid assets can understate drawdowns. Consistent valuation methods across time improve comparability.
Real-world Portfolio Context
Consider three stylized portfolios during major market episodes. These examples are illustrative and omit many practical details, but they highlight how construction choices affect drawdowns.
Equity-concentrated portfolio. A portfolio dominated by global equities will reflect equity bear markets directly. During the 2008 financial crisis, global equities experienced a large and prolonged drawdown. Recovery to prior peaks took years in many regions. Such a portfolio’s underwater curve would show a deep trough and extended duration.
Traditional stock-bond balanced portfolio. A balanced mix of equities and high-quality government bonds historically experienced smaller drawdowns than equities alone during recessions when bonds rallied. However, in 2022, both stocks and bonds declined together as inflation surprised to the upside and interest rates rose. Many balanced portfolios experienced double-digit drawdowns, underscoring regime sensitivity and the importance of considering inflation shocks in stress testing.
Diversified multi-asset portfolio. A portfolio with allocations to equities, duration, credit, real assets, and possibly alternative risk premia may experience a different pattern of drawdowns depending on the mix and correlations. The design intent is to avoid concentration in a single macro driver. The realized outcome still depends on the regime and on how liquidity and rebalancing are handled in stress.
These contexts illustrate that drawdown management is inseparable from allocation and risk budgeting choices. Even when long-run expected returns are similar, the path can differ markedly.
Practical Measurement Issues
Several practical considerations can distort measured drawdowns if not addressed.
Sampling frequency. Daily data capture intramonth volatility and can show sharp drawdowns. Monthly data smooth these moves and may understate peak-to-trough losses if markets rebound within a month. The chosen frequency should match the decisions being informed, such as daily collateral management versus quarterly governance reviews.
Lookback windows. Maximum drawdown depends on the horizon examined. A five-year window can yield a different statistic than a fifteen-year window. Reporting multiple horizons helps contextualize current experience.
Inflation adjustment. Real drawdowns, adjusted for inflation, can be materially larger than nominal drawdowns during high inflation periods. For long-horizon purchasing power, real drawdowns are relevant.
Fees and trading costs. Net-of-fee drawdowns are what investors bear. Portfolios that require frequent rebalancing or overlays may face higher costs that increase drawdowns relative to gross returns.
Model risk and nonlinearity. Statistical models often assume stable relationships that break during stress. Correlations and betas are state-dependent. Scenario analysis should allow for nonlinearity, such as convexity in fixed income or volatility feedback effects in equities.
Private asset valuation. Reported drawdowns for private equity, real estate, or private credit may lag public markets. Appraisal-based smoothing reduces measured volatility and drawdowns. Capital planning should consider look-through economic exposure rather than relying only on reported marks.
From Metrics to Policy: Designing for Resilience
Translating measurement into policy involves aligning drawdown expectations with the portfolio’s purpose and constraints. This is primarily a governance exercise.
Articulate tolerances. Define acceptable ranges for drawdown depth and duration consistent with investment horizon, liquidity needs, and stakeholder preferences. Tolerances inform allocation breadth, position sizes, and the need for overlays.
Link tolerances to operating practices. If the maximum tolerable drawdown is modest, the operating model often includes broad diversification, conservative position sizes, and robust liquidity management. If a plan can tolerate significant drawdowns, it may accept more concentrated exposures. The mapping from tolerance to design is a choice made by the governing body.
Align with liability and spending profiles. Portfolios that support regular payouts benefit from explicit cash management plans and clarity about rebalancing during stress. Capital calls for private investments should be incorporated into liquidity stress tests that assume simultaneous market declines.
Review and adapt. Periodic reviews assess whether realized drawdowns align with expectations and whether assumptions about correlations, liquidity, or financing conditions need updating. Regime shifts, such as changes in inflation dynamics, may warrant recalibrated stress tests.
Illustrative Calculations and Examples
Several simple calculations help build intuition.
Recovery math. A loss of L percent requires a gain of G percent to return to the previous peak, where G = L / (1 − L). For example, a 25 percent decline requires a 33.3 percent gain to recover. This arithmetic motivates design choices that limit the left tail of outcomes.
Sequence sensitivity under withdrawals. Consider two 10-year return paths with the same average return and volatility. If withdrawals occur, the path that begins with a deep drawdown will typically end with lower terminal wealth because capital was removed when the base was small. This effect does not require extreme assumptions. It is a mechanical consequence of compounding with cash flows.
Attribution during drawdowns. Decomposing drawdown contributions by asset and factor can reveal whether losses came from intended exposures or unintended concentrations. If a large share of the drawdown is attributable to a single factor, further diversification may be considered, subject to constraints and goals.
Common Pitfalls
Several recurring pitfalls undermine drawdown management.
Overfitting to the last crisis. Designing solely to the most recent stress leaves the portfolio exposed to different future shocks. A balanced approach uses multiple scenarios and recognizes that future crises may originate from different sources.
Ignoring funding and liquidity risk. Portfolios can meet statistical risk limits yet fail in practice if liquidity dries up. Drawdown management includes ensuring that cash, collateral, and rebalancing capacity remain adequate during stress.
Using a single metric. Maximum drawdown alone is not sufficient. Duration, recovery time, and underwater behavior matter. Multiple complementary metrics provide a fuller picture.
Relying on smoothed valuations. Understated drawdowns in illiquid assets can create complacency. Look-through analysis helps align risk assessment with economic reality.
Benchmark mismatch. Comparing portfolio drawdowns to an inappropriate benchmark can mislead governance. Benchmarks should reflect the policy mix and objectives; otherwise, deviations may be misattributed to skill or error rather than differing exposures.
Putting Drawdown Management in Context
Portfolio drawdown management is one component of a broader risk framework that also includes volatility, tracking error, and scenario sensitivities. It is distinct because it speaks directly to the investor’s experience across time. Constructing a portfolio with attention to drawdowns does not ensure a smooth path. It provides clarity about expected behavior, helps align stakeholders on tolerances, and supports deliberate responses during adverse periods.
By emphasizing measurement, thoughtful design, and disciplined monitoring, investors can increase the likelihood that their portfolios remain consistent with long-horizon plans under a range of market regimes. The objective is resilience, not perfection, and the tools of drawdown management provide a practical way to pursue that goal.
Key Takeaways
- Portfolio drawdown management focuses on the depth, duration, and recovery of losses at the total portfolio level, complementing volatility-based risk views.
- Underwater curves, maximum drawdown, duration, and recovery time provide a practical toolkit for measuring the lived path of risk.
- Design choices such as diversification across risk factors, disciplined sizing, rebalancing, and liquidity planning shape the distribution of drawdowns.
- Stress testing across historical and hypothetical regimes highlights correlation shifts and supports governance under uncertainty.
- Resilient portfolios align drawdown tolerances with long-term capital plans, acknowledging behavioral, liquidity, and regime risks.