Yield curves sit at the intersection of macroeconomics and valuation. They summarize how the cost of money varies with time, encoding information about expected policy rates, inflation, liquidity conditions, and compensation for bearing maturity risk. For fundamental analysts, the yield curve provides the starting point for discount rates, risk premia, and scenario analysis that link macro conditions to the intrinsic value of long-lived assets.
What Is a Yield Curve
A yield curve is a function that maps interest rates to maturities for a specific class of debt at a given point in time. The most referenced curve is the sovereign curve, such as the United States Treasury curve, which plots the yields to maturity of government securities from very short maturities to decades into the future. Analysts also work with swap curves, overnight indexed swap curves, corporate credit curves by rating, and inflation-protected curves.
Three related but distinct curves are commonly referenced:
- Par yield curve. The set of coupon rates that would price bonds at par across maturities. This is often what public yield tables report for government bonds.
- Spot curve. The set of zero-coupon discount rates for each maturity. It underpins rigorous valuation because each cash flow can be discounted at its own maturity-matched spot rate.
- Forward curve. The set of implied future short rates between dates, derived from the spot curve. Forward rates summarize the market-implied path of interest rates, conditional on term premia and no-arbitrage relationships.
In practice, analysts estimate the spot and forward curves from observed bond prices using methods such as bootstrapping and curve smoothing. The result is a term structure that allows each cash flow to be matched with an appropriate discount factor.
How Yield Curves Reflect Macroeconomics
At a high level, the curve is shaped by two forces. First, expectations of future short-term policy rates that reflect the outlook for growth and inflation. Second, the term premium that compensates investors for holding longer maturities with greater duration risk, liquidity risk, and uncertainty about the path of the economy. Central bank actions influence the short end directly through policy rates and the very front end through reserve conditions. Long maturities respond to expectations, term premia, and supply and demand dynamics in bond markets.
Nominal yields include compensation for expected inflation as well as real returns. The Fisher relationship links nominal yields, real yields, and inflation expectations. Inflation-protected securities, such as Treasury Inflation-Protected Securities in the United States, provide a real yield curve. The difference between nominal and real yields at the same maturities, adjusted for technical factors, is a proxy for breakeven inflation.
Curve Shapes and Their Interpretation for Valuation
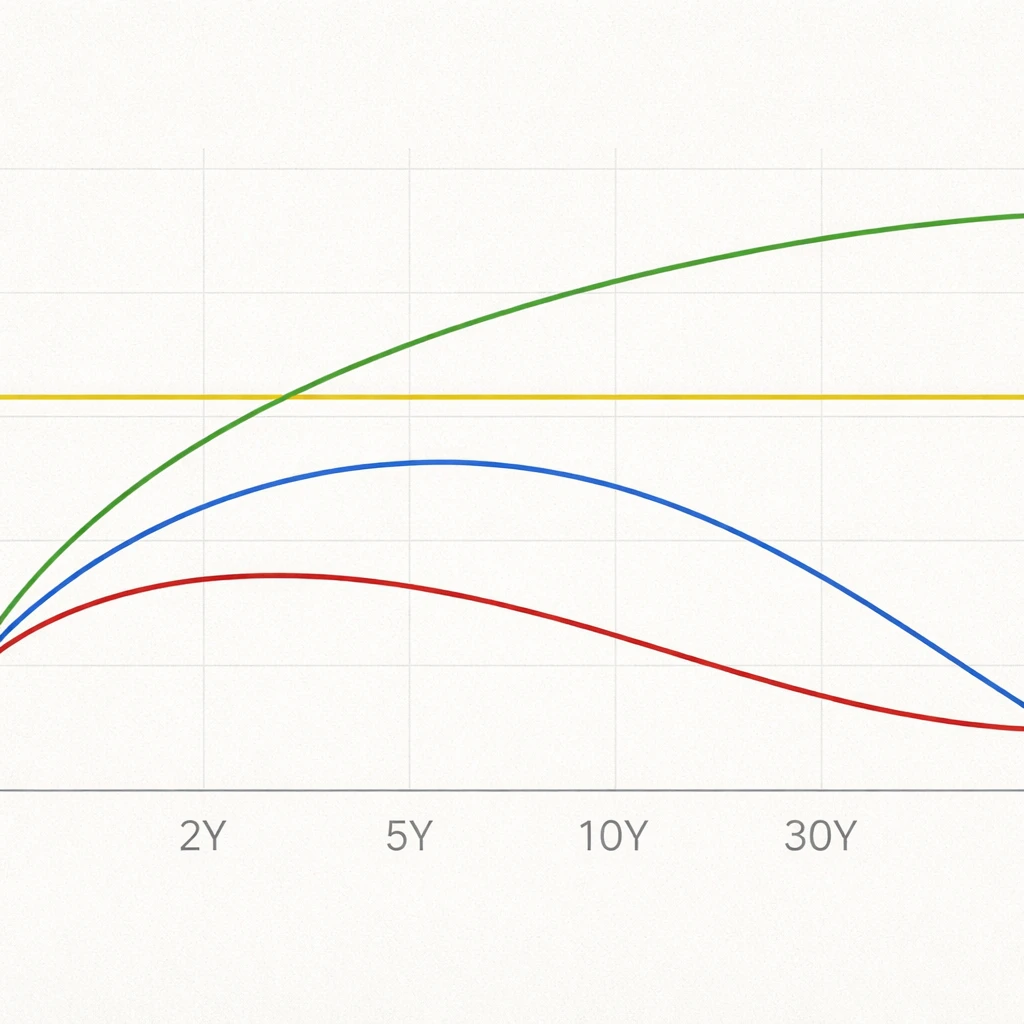
Yield curves vary in shape over time. Analysts often describe them as upward sloping, flat, inverted, or humped. The shape matters for valuation because it determines the term structure of discount rates used to evaluate cash flows of different maturities.
- Upward sloping. Long-term yields exceed short-term yields. This can reflect positive term premia, expectations of rising short rates, or both. Discount rates for far-dated cash flows are higher than near-dated rates, which generally lowers the present value of long-duration assets relative to short-duration assets, holding cash flow paths constant.
- Flat. Yields are similar across maturities. Near-term and long-term discounting are closer in level, which compresses differences in valuation between short and long cash flows.
- Inverted. Short-term yields exceed long-term yields. This can occur when markets price restrictive near-term policy or when term premia compress at the long end. The result is relatively lower discount rates for far-dated cash flows compared with near-dated ones, which can raise the present value of long-duration cash flows relative to short-duration flows, all else equal.
- Humped or mixed. Mid-maturities have higher yields than either front-end or long-end maturities. This pattern affects valuations most strongly for assets whose cash flows concentrate in the hump region.
These interpretations are mechanical properties of discounting and do not constitute forecasts. A curve’s informational content for macro conditions depends on how much of its shape comes from expectations versus term premia, both of which change over time.
From Curves to Discount Factors
To use the curve in valuation, analysts convert yields into discount factors for each cash flow date. The spot curve provides a set of zero rates that translate into discount factors. A simple example illustrates the mechanics. Suppose the annualized zero rates are 3.0 percent at one year, 3.4 percent at two years, and 3.8 percent at three years with annual compounding assumed for simplicity. The corresponding discount factors are the reciprocals of one plus the rate raised to the horizon, which yields approximately 0.971 at one year, 0.935 at two years, and 0.899 at three years. Each cash flow is multiplied by the relevant discount factor, then summed to obtain present value.
In professional settings, compounding conventions, day count, and curve bootstrapping details matter. Analysts may prefer continuously compounded spot rates because they add linearly over time when constructing forward rates. Regardless of convention, the principle is the same. Match the timing of a cash flow to the appropriate point on the curve and discount accordingly.
Why Yield Curves Matter for Long-Term Valuation
Intrinsic value depends on expected cash flows and the discount rates applied to those cash flows. The yield curve influences both elements through macro channels.
- Benchmark for the risk-free leg. Most valuation frameworks start with a risk-free term structure as the base for discounting before adding risk premia. The sovereign or overnight indexed swap curve often serves this role, depending on jurisdiction and collateralization assumptions.
- Term structure of the cost of capital. The weighted average cost of capital depends on the risk-free term structure, credit spreads, and equity risk premia. A steep or inverted curve shifts the relative weight of near-term versus long-term discounting in WACC calculations, especially for projects with long-dated cash flows.
- Inflation and real discounting. Real assets and inflation-linked cash flows are sensitive to the real yield curve. Changes in real long-end yields often have large effects on the valuation of infrastructure, utilities, and other assets with bond-like long-duration cash flows.
- Duration of cash flows. The present value sensitivity of an asset to changes in yields depends on the timing of its cash flows. Yield curve shifts that are not parallel, such as a steepening or flattening concentrated in the long end, will affect long-duration assets more than short-duration assets.
Because of these channels, the yield curve is central to long-term valuation in equity analysis, corporate finance, and project appraisal. Even when cash flows are uncertain, the shape and level of the curve determine the base rates that translate expectations into present value.
How Yield Curves Are Built in Practice
Observed bond prices inform the curve, but the curve itself is not directly observable. Analysts estimate it using bond universes and interpolation methods that produce a smooth, arbitrage-free term structure.
- Choice of instruments. Government bonds are common for nominal curves. For collateralized transactions, overnight indexed swaps can be more appropriate because they align with discounting standards in collateralized derivatives. Credit curves by rating are built from corporate bonds and credit default swap quotes.
- Bootstrapping. Starting from the shortest maturities, analysts extract zero rates by solving for discount factors that match observed bond prices. Coupon bonds are decomposed into equivalent zero-coupon components using discount factors inferred from shorter maturities, then solved sequentially for longer maturities.
- Smoothing and fitting. Parametric families, such as Nelson Siegel or Svensson specifications, fit curves with a small number of parameters that capture level, slope, and curvature. Nonparametric spline methods provide flexible fits at the cost of potential overfitting if not regularized.
- Real curves and breakevens. Inflation-protected securities provide a real curve. The difference between nominal and real yields at common maturities gives a breakeven inflation curve that can be used to separate real discounting from inflation compensation.
Curve construction choices should align with the asset being valued. For example, discounting fully collateralized cash flows often uses an OIS curve, whereas discounting unsecured corporate cash flows uses a risk-free base plus a credit spread term structure.
Nominal, Real, and Inflation Expectations
Valuation requires consistent treatment of inflation. Discounting nominal cash flows with nominal rates is equivalent to discounting real cash flows with real rates, provided inflation assumptions are consistent. The real curve derived from inflation-protected securities reflects investors’ required real returns before inflation compensation. The difference between nominal and real curves across maturities, adjusted for liquidity and technical factors, provides the breakeven inflation curve.
Analysts often compare breakeven inflation to their inflation outlook when stress-testing valuations. If breakeven inflation rises, nominal yields can increase even if real yields are unchanged, which elevates nominal discount rates and lowers present values for nominal cash flows. Conversely, a decline in real long-end yields can raise the value of long-lived assets even if inflation compensation is stable.
Credit Curves and the Term Structure of Spreads
Beyond sovereign or OIS curves, corporate valuation often requires a credit curve that maps credit spreads to maturities for a given rating or issuer. The spread curve reflects expected default risk, recovery rates, liquidity, and market risk premia. Spreads can be represented in yield terms or as hazard rates in a survival framework where cash flows are weighted by survival probabilities and expected recoveries.
Spread term structures come in various shapes. Upward sloping spreads indicate higher compensation for bearing long-term credit risk. Downward sloping spreads can occur when near-term default risk or liquidity concerns dominate. These shapes influence present value by altering the discount rates layered on top of the risk-free curve.
Using Yield Curves in Fundamental Analysis
Fundamental analysis uses the curve in several structured ways:
- Discounted cash flow valuation. Match projected cash flows to spot rates from the appropriate curve and compute present value. For equity, the analyst often incorporates an equity risk premium into the discount rate beyond the risk-free base. For debt, the curve plus an issuer- or rating-specific spread provides a consistent valuation framework.
- Cost of capital estimation. The risk-free term structure enters the cost of equity and cost of debt. A project with a back-loaded payoff profile is more sensitive to the long end of the curve than one with near-term payoffs.
- Scenario analysis. Forward rates implied by the curve provide internally consistent interest rate paths for scenarios. These can be used to test how refi costs, interest coverage, and asset values respond to shifts in the curve. Forward rates are not unbiased forecasts, but they organize expectations under no-arbitrage constraints.
- Real versus nominal modeling. For assets with inflation-linked revenues or costs, a real discounting framework built on the real curve can clarify value drivers and isolate inflation risk.
Practical Valuation Example
Consider a simplified infrastructure project that produces stable nominal cash flows of 100 annually for 30 years with minimal growth. Suppose the relevant nominal spot curve is 2.5 percent at one year, gradually rising to 4.0 percent at 30 years. If one were to discount the early cash flows at roughly 2.5 to 3.0 percent and the later cash flows at 3.5 to 4.0 percent, the present value would reflect a higher weight on long-end discounting due to the project’s long duration. If the curve flattened such that the long end fell by 50 basis points while the front end rose by 50 basis points, the present value would likely increase, because the later, larger share of discounted value benefits from the lower long-end rates. The magnitude would depend on the precise cash flow schedule and compounding conventions, but the direction derives mechanically from duration.
Now contrast this with a manufacturing company planning a five-year equipment upgrade that yields incremental cash flows concentrated in years one through five. A steepening in the curve that raises five-year rates but leaves the long end unchanged would directly affect the valuation of this project more than the 30-year asset, because a greater portion of its present value sits in the front and belly of the curve.
These examples highlight a key principle. The location of cash flows along the maturity spectrum determines which parts of the curve matter most. Spot rates, not a single averaged rate, provide a coherent way to reflect this in valuation.
Market Context Example
Between late 2018 and 2020, the United States Treasury curve experienced phases of flattening and inversion at various maturities. Policy rates rose, inflation expectations shifted, and term premia evolved amid quantitative policy changes. During this period, discount rates for nearer maturities increased relative to long maturities at several points, altering the relative valuation sensitivity of assets with different durations. For issuers, the shape of the curve influenced the timing and tenor of debt issuance, with some firms opting for extended maturities to lock in comparatively lower long-end yields while others emphasized short-term funding where market conditions permitted. For analysts, translating the observed curve into spot and forward rates helped clarify which segments of the term structure were driving changes in present value across projects and business models.
Curve Dynamics and Macro Channels
Several macroeconomic forces interact with the curve:
- Monetary policy. Policy rate changes and balance sheet operations influence short rates and, through expectations and term premium channels, can affect the entire curve.
- Inflation dynamics. Changes in inflation expectations and shocks to realized inflation affect nominal yields and the breakeven curve.
- Growth and risk appetite. Shifts in growth outlook influence expectations for policy and risk premia. Periods of heightened uncertainty can widen term premia in either direction depending on demand for duration as a hedge or as a risk.
- Supply and demand. Treasury issuance patterns, regulatory changes affecting demand for safe assets, and pension or insurance hedging needs can move the long end independently of near-term policy expectations.
Understanding these channels helps analysts interpret movements in the curve without relying on any single narrative. The same curve shape can arise from different combinations of expectations and term premia, which has distinct implications for valuation and risk.
Forward Rates and What They Mean
Forward rates are implied from the spot curve under no-arbitrage conditions. They provide the rate that would apply for a future period to make an investor indifferent between paths of investment. Analysts use forward curves to construct internally consistent projections for discounting and for assessing the timing of refinancing or capital expenditures. It is crucial to note that forward rates are not necessarily unbiased predictions of future short rates. Time-varying term premia and risk preferences can drive a wedge between forwards and future realizations.
Common Pitfalls When Using Yield Curves
Several pitfalls can distort valuation if not addressed carefully.
- Mismatched curves. Discounting unsecured cash flows with a collateralized discount curve, or vice versa, can bias value. Choose a curve consistent with the nature of the cash flows.
- Ignoring term premia. Treating the curve as pure expectations of future policy can misinterpret the information content. Term premia matter, especially at the long end.
- Assuming parallel shifts. Curves rarely move in lockstep across maturities. Scenario analysis should allow for level, slope, and curvature changes.
- Overreliance on a single market. In some jurisdictions, liquidity is concentrated at specific maturities. Sparse or off-the-run bond pricing can lead to noisy curve estimates.
- Inconsistent inflation treatment. Mixing real and nominal quantities can create valuation errors. Align inflation assumptions with the chosen curve.
Global Curves and Currency Considerations
Multinational valuation involves multiple yield curves and exchange rates. An analyst might discount euro cash flows using the euro OIS curve and dollar cash flows using the United States OIS curve, then convert at appropriate exchange rate assumptions. Covered interest parity links forward exchange rates to interest rate differentials, although cross-currency basis can lead to deviations due to collateral and funding frictions. When valuing cash flows across jurisdictions, the consistency of discounting, inflation assumptions, and currency conversion is more important than any single curve choice.
Duration, Convexity, and Nonparallel Shifts
The sensitivity of present value to curve changes depends on the distribution of cash flows over time. Duration measures the first-order sensitivity to yield changes, and convexity captures second-order effects. For assets with long-duration cash flows, changes in long-end yields can outweigh movements at the front end. Nonparallel shifts matter because a steepening that raises long-end yields while lowering front-end yields will affect long-duration and short-duration valuations differently. Incorporating these sensitivities into fundamental analysis helps clarify which curve segments pose the greatest valuation risk for a given asset.
Data Sources and Practical Implementation Notes
Yield curve data are published by central banks, debt management offices, and market data providers. Par yields are readily available for sovereign bonds. Spot and forward curves can be obtained from analytics systems or constructed using bond and swap quotes. When implementing valuations:
- Specify compounding and day-count conventions and use them consistently.
- Match cash flow maturities to spot rates rather than using a single weighted average rate.
- Check the stability of the curve fit and avoid extrapolating far beyond liquid maturities.
- For inflation-linked analysis, use real spot curves and breakeven curves appropriate to the jurisdiction.
Extended Illustration: Equity Valuation with a Term Structure
Imagine an equity analyst valuing a company with two distinct cash flow phases. For the next three years, free cash flow is modest as the firm invests. From year four through year fifteen, cash flows ramp up significantly. The analyst builds a nominal spot curve from the sovereign curve that starts at 3.0 percent for one year, rises to 3.6 percent by five years, and then stabilizes near 3.8 percent beyond ten years. The analyst also estimates an equity risk premium and firm-specific adjustments, but those are layered on top of the risk-free term structure.
When discounting, the early low cash flows receive near-front-end spot rates around 3.0 to 3.4 percent, while the bulk of value in years four to fifteen is discounted at 3.6 to 3.8 percent plus the appropriate risk premiums. If the curve were instead inverted with one-year rates at 5.0 percent and ten-year rates at 3.5 percent, the weighted discount rate applied to the ramp-up phase would be lower, raising the present value of the later cash flows relative to the earlier period, holding risk premia and cash flows constant. The point is not that one shape is favorable in an absolute sense, but that the curve’s shape shifts the distribution of discounting pressure over time.
Policy Shifts and Structural Factors
Structural changes in policy and regulation can reshape the curve beyond cyclical influences. Large-scale asset purchases by central banks can compress term premia at targeted maturities. Regulatory liquidity requirements can create persistent demand for certain maturities, altering the slope and curvature. Demographic trends and liability-driven investment among pensions and insurers can elevate demand for long-duration assets, influencing the long end. These forces change the interpretation of the curve and its implications for valuation even when short-term macro data are stable.
Putting It Together
For fundamental analysis, the yield curve is a toolkit rather than a single number. It provides maturity-specific discount rates, a decomposition of nominal rates into real rates and inflation compensation, and a map of forward rates for scenario design. It links macroeconomic conditions to valuation in a disciplined way. By matching cash flows to spot rates, aligning real or nominal frameworks with the nature of cash flows, and being explicit about the curve used, analysts can produce valuations that are internally consistent and sensitive to the most relevant parts of the term structure.
Key Takeaways
- A yield curve maps interest rates to maturities and is foundational for discounting cash flows in fundamental analysis.
- The curve’s shape reflects expectations for policy and inflation as well as time-varying term premia, all of which affect long-term valuation.
- Spot and forward curves derived from observed prices enable maturity-matched discounting and coherent scenario analysis.
- Consistent treatment of nominal versus real discounting, and careful choice of the appropriate curve, are essential to avoid valuation errors.
- Curve movements are often nonparallel, so valuation sensitivity depends on the timing of cash flows and the parts of the curve that move.