Fundamental analysis relies on more than individual line items or a single accounting period. Reading financial statements together refers to the disciplined practice of evaluating the income statement, balance sheet, cash flow statement, and statement of shareholders’ equity as an integrated whole. The idea is simple but powerful. Each statement tells part of the story, and only by linking them do we see the economics of a business with clarity.
When the statements are read in isolation, apparent strengths can mask weaknesses. Rapid growth in revenue may coincide with rising receivables and heavy customer incentives that depress cash generation. A company may report strong earnings while financing that performance with increasing leverage. Understanding intrinsic value requires tracing how accounting profits convert into cash, how assets are funded, and how capital is allocated across time.
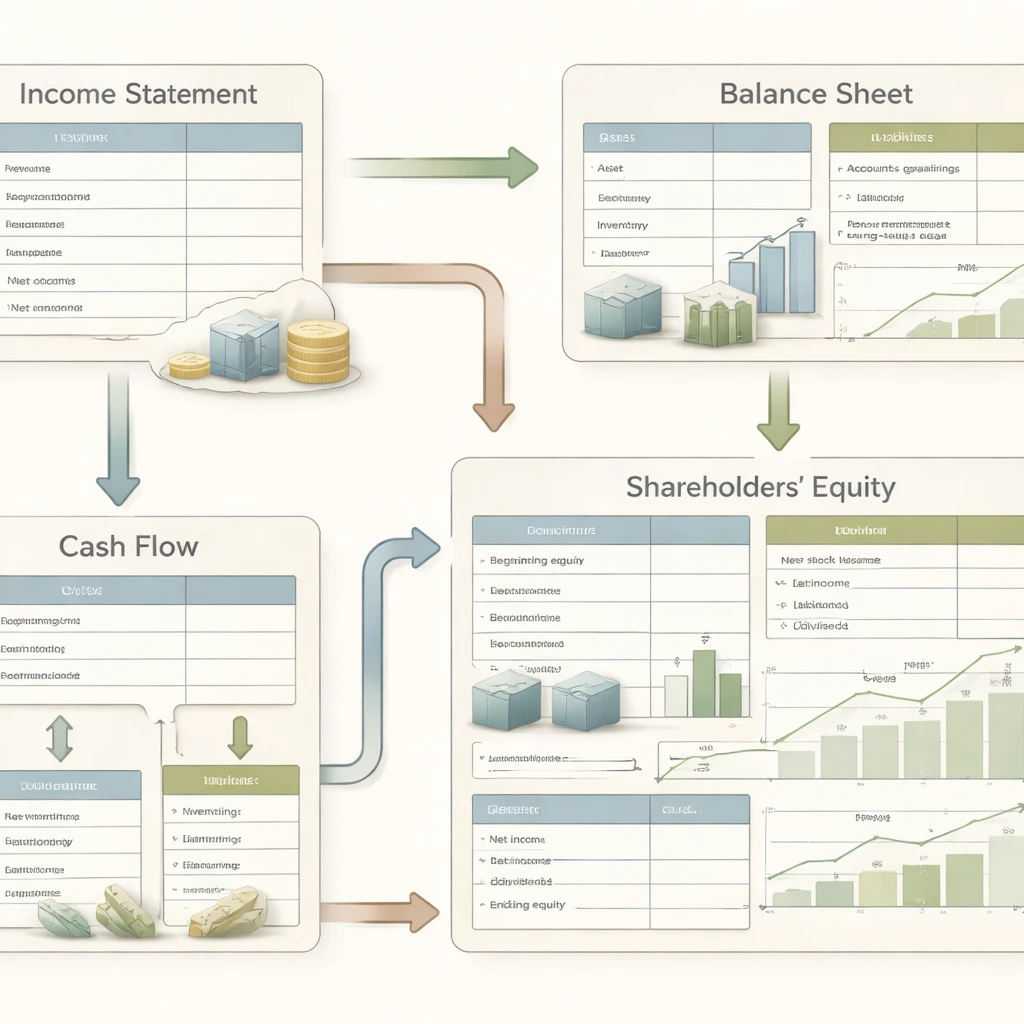
What It Means to Read Statements Together
Reading statements together means tracing connections and reconciling the flow of value across the four core reports:
- The income statement measures performance over a period through revenues and expenses, culminating in net income.
- The balance sheet provides a snapshot of assets, liabilities, and shareholders’ equity at period end.
- The cash flow statement explains changes in cash by operating, investing, and financing activities.
- The statement of shareholders’ equity reconciles changes in equity accounts, including retained earnings, issuances, buybacks, and other comprehensive income.
These statements are interdependent. Net income from the income statement feeds retained earnings in equity. Depreciation reduces net income yet is added back in operating cash flow because it is noncash. Working capital accounts on the balance sheet, such as receivables, payables, and inventory, drive the operating cash flow reconciliation. Financing choices alter capital structure on the balance sheet and appear in cash flows from financing. Reading the statements in concert allows an analyst to triangulate the economic reality underlying the reported numbers.
Why the Integrated View Matters for Long-Horizon Valuation
Intrinsic value reflects the present value of future cash flows available to providers of capital, subject to the risks of achieving those flows. An integrated reading of the statements helps illuminate three valuation-relevant dimensions.
1. Earnings quality and the cash conversion of profit. Reported earnings can deviate from cash generation due to accruals, timing, and accounting estimates. The operating section of the cash flow statement reconciles net income to operating cash flow, highlighting the role of working capital and noncash items. Persistent gaps between earnings and cash that are not explained by deliberate investment in working capital often signal differences between accounting recognition and underlying economics.
2. Reinvestment and growth capacity. Growth that adds value requires reinvestment at returns above the cost of capital. The balance sheet shows the stock of invested capital. The cash flow statement shows the flow of reinvestment through capital expenditures and acquisitions. The income statement reveals whether that investment translates into rising operating income without disproportionate increases in costs. Reading across the statements clarifies whether growth relies on heavy incremental capital or can be sustained with modest investment.
3. Capital structure and resilience. The balance sheet and the financing section of the cash flow statement show how operations are funded. Leverage amplifies outcomes and affects the distribution of cash between debt and equity holders. The equity statement captures dilution or buybacks that alter each shareholder’s claim. For long-term valuation, the durability of cash flow under different financing choices is essential.
Linkages Across the Four Statements
Several mechanical linkages are central to reading the statements together. Understanding these connections prevents double counting and highlights where to focus attention.
Retained earnings linkage. Beginning retained earnings plus net income minus dividends equals ending retained earnings. This reconciliation bridges the income statement and the equity statement. If net income rises but retained earnings stagnate, distributions or other equity adjustments are absorbing that increase.
Working capital bridge. Changes in receivables, inventory, payables, and other operating accounts explain the gap between net income and operating cash flow. Rising receivables relative to revenue can indicate looser credit terms. Declining payables can reflect tighter supplier payments or the loss of trade credit.
Noncash expenses and the cash flow reconciliation. Depreciation, amortization, stock-based compensation, and impairment charges reduce income but do not directly consume cash in the period. These items are added back in operating cash flow. Frequent impairments, however, may reveal earlier optimism in capitalized assets and require a closer look at investment discipline.
Investing flows and the asset base. Capital expenditures increase property, plant, and equipment on the balance sheet. Acquisitions increase goodwill and other intangibles. Divestitures and disposals reduce the asset base and produce investing cash inflows. Reading PP&E rollforwards and intangible asset notes alongside cash flows clarifies the scale and nature of reinvestment.
Financing flows and capital structure. Issuances or repayments of debt and equity appear in financing cash flows and reshape liabilities and shareholders’ equity. The equity statement provides detail on share issuances, buybacks, option exercises, and accumulated other comprehensive income. The balance sheet confirms the resulting capital structure at period end.
Earnings Quality: Accruals, Timing, and Sustainability
Earnings quality is not a single metric. It emerges from the interplay between income recognition, cash realization, and the durability of the underlying economic activity.
Accrual intensity. High accruals indicate that a larger portion of earnings comes from noncash adjustments. Analysts often examine the aggregate accruals implied by the operating cash flow reconciliation. When accruals dominate for extended periods without a clear strategic rationale, questions arise about how revenues are recognized or how costs are capitalized.
Revenue recognition and contract structures. For companies with multiyear contracts or subscription models, deferred revenue and contract assets play a central role. The balance between billed cash and recognized revenue explains timing differences. Growth in deferred revenue coupled with strong cash collections can be healthy, while recognized revenue far outpacing billings may require scrutiny.
Expense capitalization. Some costs are capitalized and amortized rather than expensed immediately. Capitalized software development, internal-use software, and certain customer acquisition costs are examples. Reviewing the investing cash flows, PP&E and intangible rollforwards, and the notes helps determine whether capitalization aligns with the expected economic life of the asset.
Cash Flow: The Engine of Intrinsic Value
The cash flow statement complements accrual accounting by showing actual cash inflows and outflows. The categorization into operating, investing, and financing activities allows the analyst to separate recurring business cash generation from resource allocation choices and capital structure decisions.
Operating cash flow. High-quality operating cash flow generally reflects sustained earnings, disciplined working capital, and manageable noncash adjustments. Volatility in working capital can obscure trends, so analysis often focuses on multi-period patterns rather than a single quarter or year.
Investing cash flow. Capital expenditures, acquisitions, and asset sales reveal how a company builds or reshapes its asset base. Separating maintenance capital spending from growth investment provides insight into the minimum cash required to keep assets productive. While maintenance levels are not always disclosed, management commentary and the age profile of assets can provide clues.
Financing cash flow. Issuances and repayments of debt and equity, along with dividends and share repurchases, describe how value is distributed between stakeholders. Sustained negative free cash flow combined with heavy financing inflows may be appropriate during early growth, but the longer that pattern persists without improving unit economics, the more important it becomes to test the underlying assumptions.
Balance Sheet Structure and Economic Risks
The balance sheet organizes claims on the company’s resources. Reading it alongside the other statements highlights both capacity and constraints.
Liquidity and working capital. The composition of current assets and liabilities affects operational flexibility. Adequate liquidity can reduce the need for costly external financing during downturns. Trends in days sales outstanding, inventory turns, and days payables outstanding are often used to interpret efficiency, though the precise metrics vary by industry.
Leverage and coverage. Debt introduces fixed obligations that must be met from cash flows. Interest expense on the income statement and the maturity schedule disclosed in the notes jointly describe risk. When operating income is thin relative to interest expense, even modest shocks can strain coverage.
Intangibles and economic assets. Goodwill and other intangibles reflect acquired expectations about future benefits. Large intangible balances are not inherently problematic, but they require careful reading of segment performance and impairment tests to assess whether those expectations are being met.
Statement of Shareholders’ Equity and Ownership Dynamics
The equity statement details how the ownership interest evolves. Components include common stock, additional paid-in capital, retained earnings, treasury stock, and accumulated other comprehensive income. The equity statement is essential for understanding dilution from stock-based compensation, the scale of share repurchases, and the relationship between net income and distributions. When net income grows while share count also rises, per-share metrics may tell a different story than consolidated totals.
From Integrated Reading to Intrinsic Value
Intrinsic value is grounded in expectations of future cash flows and the risks of achieving them. Reading statements together informs those expectations in several ways.
Durability of operating margins. The income statement shows margin trends, but their sustainability depends on reinvestment needs and competitive dynamics that surface in cash flows and balance sheet structure. If gross margins expand while capitalized costs accumulate on the balance sheet, margin durability may be overstated.
Reinvestment efficiency. The relationship between incremental operating income and incremental invested capital indicates whether growth creates value. Capital intensity shows up in capital expenditures and working capital growth, while returns are reflected in operating profits.
Distribution capacity. Available cash for distribution is constrained by reinvestment requirements and financing obligations. The cash flow statement and the equity statement together indicate whether distributions are supported by core cash generation or financed by new capital.
Risk profile. The balance sheet and financing cash flows illuminate sensitivity to funding conditions. High reliance on short-term financing or variable-rate debt can amplify risk in tightening cycles.
A Three-Year Illustrative Example
Consider a simplified manufacturer over three years. The numbers are stylized and serve to illustrate linkages, not to forecast outcomes.
Income statement summary
- Year 1: Revenue 1,000, Operating income 80, Net income 50
- Year 2: Revenue 1,150, Operating income 95, Net income 60
- Year 3: Revenue 1,320, Operating income 100, Net income 55
Balance sheet highlights at year-end
- Accounts receivable: 120, 160, 210
- Inventory: 220, 240, 290
- Accounts payable: 140, 150, 160
- PP&E, net: 400, 470, 540
- Debt: 300, 360, 420
- Retained earnings: 200, 250, 280
Cash flow statement summary
- Operating cash flow: 70, 40, 10
- Investing cash flow: Capital expenditures of 80, 120, 120
- Financing cash flow: Net debt issuance of 20, 70, 70
Read separately, the income statement suggests moderate revenue growth from 1,000 to 1,320 across three years, with operating income expanding in the first two years and then flattening. Net income dips in Year 3 after several unusual items. Without the other statements, it would be easy to conclude that profitability is broadly stable.
Reading across the statements changes the picture. Receivables rise from 120 to 210, outpacing revenue growth. Inventory grows from 220 to 290, faster than cost of goods sold would suggest if turns were stable. Payables increase modestly. The net working capital build explains why operating cash flow trails net income and declines from 70 to 10. The cash flow statement makes this explicit in the reconciliation of net income to operating cash flow. The company is funding customer terms and carrying more inventory to support wider product variety or longer lead times.
At the same time, capital expenditures exceed depreciation, which increases PP&E from 400 to 540. The investing cash flows reveal a sustained reinvestment program. With operating cash flow weakening, the company turns to debt financing, as shown by the net issuances in financing cash flows and the higher debt balance on the balance sheet. Interest expense grows, contributing to the Year 3 net income decline.
What does this integrated reading say about intrinsic value drivers? The revenue growth in the income statement reflects a strategy that requires heavy working capital and capital expenditures. Unless the incremental returns on this investment exceed the cost of capital, value creation will be limited. The cash flow statement indicates that internal cash generation is insufficient to fund the plan without additional borrowing. The balance sheet shows rising leverage, which increases risk. The equity statement, if shown, would reveal that retained earnings rise more slowly than net income due to distributions or other equity movements, further constraining capacity to self-fund.
None of these observations prescribe an action. They simply illustrate how the four statements, when read together, illuminate the economic mechanism behind the reported numbers. Over longer horizons, analysis would focus on whether the increased asset base produces higher operating income and stronger operating cash flow, which would validate the reinvestment program, or whether returns fail to keep pace with the cost of financing.
Industry Context and Statement Patterns
Patterns differ meaningfully across industries, and the integrated reading should adjust accordingly.
Software and subscription models. Deferred revenue and contract liabilities figure prominently. Operating cash flow may outpace net income when cash is collected upfront. Capitalized software and stock-based compensation affect both the cash flow statement and the equity statement. The balance between growth investment and customer retention costs becomes visible across the statements.
Retail and consumer goods. Inventory management and payables terms drive working capital. Seasonal patterns can distort single-period readings. Capital expenditures for store openings or distribution centers are central to understanding reinvestment needs. Lease commitments, whether recognized on the balance sheet or disclosed in notes, alter the interpretation of leverage.
Manufacturing and capital-intensive sectors. Fixed asset cycles and depreciation schedules shape the relationship between earnings and cash. Long production cycles and project-based work create lumpy working capital needs. Impairments in downturns reveal mismatches between prior capitalization and realized demand.
Financial institutions. For banks and insurers, the income statement and balance sheet are deeply intertwined. Traditional working capital metrics are less informative. Regulatory capital, credit loss provisions, and interest rate risk management dominate the reading of the statements.
Common Analytical Checks When Reading Together
An integrated review often includes a consistent set of cross-statement checks. These are not formulas to memorize but lenses to ensure the numbers reconcile to a coherent economic narrative.
- Trace net income to operating cash flow and explain major reconciling items. Persistent discrepancies merit investigation.
- Compare revenue growth with changes in receivables and inventory. Large divergences can indicate channel stuffing, extended terms, or building inventory for anticipated demand.
- Contrast capital expenditures and acquisitions with growth in operating income. Rising asset base without commensurate profit improvement reduces asset efficiency.
- Examine financing cash flows relative to free cash generation. If distributions occur alongside sustained external financing, assess whether distributions are supported by core cash flows.
- Reconcile changes in shareholders’ equity with net income, buybacks, issuances, and other comprehensive income. Look for dilution that offsets per-share progress.
Notes, Disclosures, and the MD&A
The four primary statements summarize a complex underlying reality. Critical details frequently sit in the notes and in management’s discussion and analysis. Revenue recognition policies, lease terms, contingencies, segment reporting, customer concentration, and nonrecurring items often require supplementary reading. When the statements and the disclosures move in different directions, the integrated picture is incomplete.
Trend and Common-Size Analysis
Reading across time is just as important as reading across statements. Trend analysis compares the evolution of key lines over multiple periods. Common-size analysis expresses each line as a percentage of a relevant base, such as revenue for the income statement or total assets for the balance sheet. Together, these approaches highlight structural changes in cost mix, capital intensity, and funding. A rising share of intangible assets, for example, may align with a business model shift or with acquisitions that rely on purchased goodwill rather than organic development.
From Integration to Forecasting Without Overreach
Forecasts inform valuation models, but they should be anchored in the integrated reading of the historical statements. A coherent forecast aligns the income statement, balance sheet, and cash flow statement so that growth assumptions correspond to plausible working capital and capital expenditure requirements. If the model projects higher margins, it should also account for any associated increases in investment that the historical relationship suggests. The equity statement then reflects the implied distributions, buybacks, or issuances that close the loop.
A Practical Workflow
A structured process helps maintain discipline and avoids overemphasizing isolated datapoints. One example of a practical workflow is as follows.
- Begin with a multi-period view of the four statements and scan for inflection points in revenue, margins, working capital, and financing flows.
- Reconcile net income to operating cash flow and attribute the difference to specific categories, such as receivables, inventory, payables, and noncash charges.
- Map investing cash flows to changes in PP&E and intangibles. Distinguish maintenance from growth where possible, using disclosures for guidance.
- Review financing activity in the context of free cash generation. Link debt changes to interest expense and maturities. Link equity movements to share count and per-share metrics.
- Cross-check the statement of shareholders’ equity to understand dilution, distributions, and other comprehensive income that can affect book value and reported equity returns.
Limitations and Judgments
Reading statements together improves understanding, but it does not eliminate uncertainty. Accounting standards allow for judgment in revenue recognition, asset lives, and expense classification. Business models evolve, acquisitions change baselines, and external conditions alter financing costs. The integrated approach disciplines the analysis by insisting that earnings, cash flows, and capital structure fit together, but it still requires interpretation and humility about what the numbers can and cannot reveal.
Real-World Context
Market history offers numerous episodes where cross-statement reading clarified risks that a single statement obscured. During periods of rapid expansion in consumer credit, income statements of lenders showed rising interest income while the balance sheet accumulated riskier receivables. The cash flow statement reflected funding needs tied to loan growth. When credit conditions tightened, provisions increased and operating cash flow declined, revealing a fragility that was less apparent in the initial revenue growth. In another context, fast-growing subscription businesses reported negative operating margins but positive operating cash flow due to upfront billings, deferred revenue, and efficient renewals. The integrated reading clarified that the timing and sustainability of cash inflows differed from what the income statement alone suggested. These examples underscore that valuation hinges on the interaction among performance, reinvestment, and financing, not on any single line item.
Concluding Perspective
Reading financial statements together is a foundational skill in fundamental analysis. The practice ties accounting performance to cash flows and balance sheet capacity, and it connects ownership dynamics to the economic distribution of value. It helps the analyst evaluate whether reported progress rests on sustainable economics and whether the asset base and capital structure can support long-term plans. Although the method does not answer every question, it frames the right ones and builds a coherent link between historical evidence and forward-looking judgment about intrinsic value.
Key Takeaways
- Reading statements together means linking earnings, cash flows, balance sheet changes, and equity movements into one economic narrative.
- Earnings quality depends on accrual intensity, working capital discipline, and the sustainability of revenue recognition and expense policies.
- The cash flow statement reveals how profits convert to cash and how reinvestment and financing shape capacity and risk.
- Balance sheet structure and the equity statement clarify resilience, ownership dynamics, and the distribution of value over time.
- Integrated analysis improves long-term valuation by connecting performance, reinvestment efficiency, and capital structure to future cash flow potential.