Corporate earnings are the profits a business generates after accounting for all costs of doing business. In financial reporting, the term typically refers to net income, the bottom line of the income statement. Earnings indicate a firm’s ability to convert revenue into profit over a defined period and are central to fundamental analysis because they connect operating performance to long-term intrinsic value. Understanding what earnings measure, the choices embedded in their calculation, and their relation to cash flow provides a foundation for evaluating businesses across industries and through economic cycles.
Defining Corporate Earnings
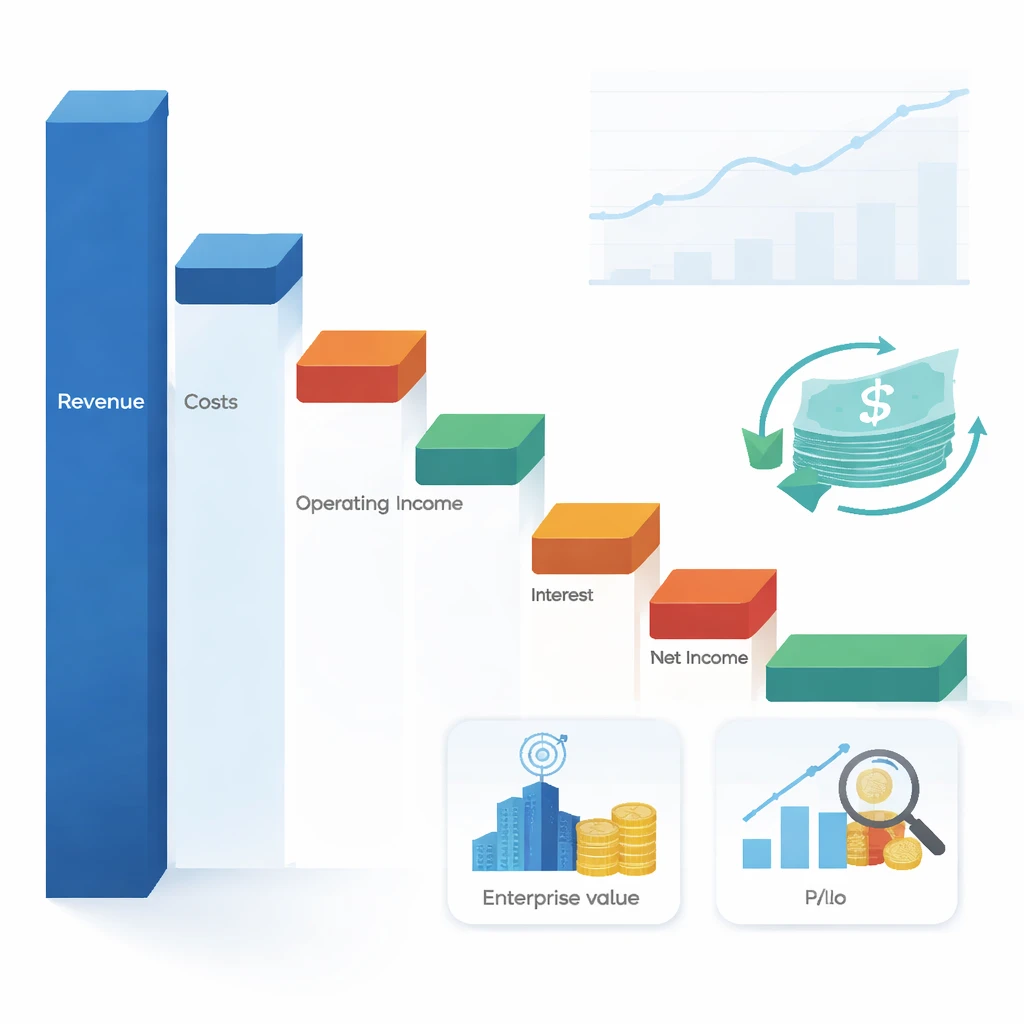
In the simplest form, corporate earnings are net income. A company starts with revenue, subtracts operating costs, interest, taxes, and any other gains or losses, and arrives at net income attributable to shareholders. This figure summarizes the period’s profitability under accounting rules. While net income is the most common measure, analysts often study related concepts such as operating income, earnings before interest and taxes, and diluted earnings per share to understand the drivers of profitability.
Earnings are reported in the income statement for a quarter or a year. Because accounting is accrual based, earnings reflect both cash and non-cash items. Depreciation, amortization, and changes in working capital timing influence reported results even when no immediate cash inflow or outflow occurs. These features make earnings informative but also require careful interpretation.
From Revenue to Net Income: The Income Statement Path
To understand what earnings capture, it helps to follow the income statement from top to bottom:
- Revenue: The value of goods or services delivered to customers in the period, recorded when earned under revenue recognition rules.
- Cost of goods sold: Direct costs tied to producing or delivering the product or service. Subtracting these costs from revenue yields gross profit.
- Operating expenses: Selling, general, and administrative costs, along with research and development. Subtracting operating expenses from gross profit yields operating income, also called EBIT.
- Interest expense and other income: Financing costs and non-operating gains or losses.
- Taxes: The expense related to current and deferred tax obligations.
- Net income: Profit attributable to shareholders after all expenses and non-operating items.
Analysts also review earnings per share in two forms. Basic EPS uses the current share count, and diluted EPS assumes conversion of stock options and other potentially dilutive securities. Diluted EPS better captures the claim on earnings available to each share if all dilutive instruments were exercised.
GAAP, IFRS, and Non-GAAP Presentations
Most large companies report under either U.S. GAAP or IFRS. Both frameworks emphasize accrual accounting and require recognition and measurement rules for revenue, expenses, and taxes. The two frameworks are broadly similar, though differences remain in areas like development costs, impairment testing, and some presentation choices. Public companies often supplement GAAP or IFRS earnings with non-GAAP or adjusted earnings that exclude items management considers unusual or non-recurring. Common adjustments include restructuring charges, acquisition-related costs, stock-based compensation, or gains and losses on asset sales.
Adjusted figures can improve comparability across periods when they remove genuinely unusual items. They can also obscure true costs if they exclude recurring expenses. A careful reader evaluates both reported and adjusted earnings, understands the reconciliation between them, and judges whether the adjustments match economic reality.
Accrual Accounting and Timing Effects
Accrual accounting aims to match revenue with the expenses required to generate it. Revenue is recognized when control of goods or services is transferred, not necessarily when cash is received. Similarly, expenses are recognized when incurred, not when paid. This timing creates differences between earnings and cash flow.
Several non-cash items influence earnings:
- Depreciation and amortization: Allocation of past capital expenditures over the useful life of long-lived assets and intangible assets.
- Stock-based compensation: A non-cash expense that reflects share-based awards granted to employees. It dilutes ownership even though it does not require cash outlay in the period.
- Provisioning and reserves: Estimates for doubtful accounts, warranties, or litigation. Changes in estimates affect current earnings and can be judgment intensive.
- Deferred taxes: Timing differences between accounting income and taxable income give rise to deferred tax assets and liabilities, which affect the tax expense recognized in the period.
Because of these factors, two companies with identical cash inflows and outflows can report different earnings depending on accounting choices and estimates. Understanding those choices is central to evaluating the sustainability and quality of earnings.
Earnings Quality: Recurring vs Non-Recurring
Earnings quality refers to how closely reported earnings reflect the durable, underlying economics of the business. High-quality earnings are repeatable, come from core operations, and require limited heroic assumptions. Lower quality earnings rely on one-time items, aggressive estimates, or non-operating gains.
Common issues that affect quality include:
- One-time gains or charges: Asset sales, legal settlements, or restructuring expenses can move earnings in a given period without indicating a change in ongoing performance.
- Working capital swings: Changes in receivables, inventory, or payables can boost or suppress earnings through revenue recognition or cost of sales timing.
- Capitalizing costs: When costs are capitalized and amortized instead of expensed immediately, near-term earnings rise. The appropriateness of capitalization depends on accounting standards and business context.
- Revenue recognition judgments: Long-term contracts, subscription bundling, and variable consideration require estimates that can shift reported revenue among periods.
- Tax rate variability: A temporarily low effective tax rate can inflate net income. Analysts often normalize tax rates to assess sustainable earnings.
Evaluating earnings quality calls for reading the financial statement footnotes, management’s discussion and analysis, and the reconciliation of non-GAAP items. Trends in margins, consistency of policies, and alignment between earnings and cash flow all inform judgment about sustainability.
Earnings and Cash Flow: Complementary Views
Earnings and cash flow are related but distinct. The statement of cash flows reconciles net income to cash provided by operating activities by adjusting for non-cash items and changes in working capital. Analysts often compute free cash flow by subtracting capital expenditures from operating cash flow. Free cash flow represents cash available for debt repayment, dividends, repurchases, or reinvestment.
Several points connect earnings to cash flow analysis:
- Non-cash expenses: Depreciation and amortization lower earnings but do not consume cash in the current period. Their economic relevance depends on future capital expenditure needs to maintain or grow capacity.
- Working capital timing: Rapid growth can consume cash as receivables and inventory build. Earnings may look strong while cash flow is temporarily weak.
- Capital intensity: Two companies with the same earnings may require different levels of capital expenditure to sustain those earnings. The more capital intensive firm often produces less free cash flow at the same earnings level.
- EBITDA usefulness and limits: EBITDA removes non-cash charges but also ignores required reinvestment. It can help compare operating performance across firms, yet it is not a measure of owner earnings by itself.
In valuation work, earnings serve as a proxy for the capacity to generate cash over time. Differences between earnings and cash flow guide adjustments and help identify what is transient versus persistent.
How Earnings Inform Fundamental Valuation
Analysts connect earnings to intrinsic value through several frameworks. Each approach asks whether the level and growth of earnings are sufficient to justify the current price, given risk and reinvestment needs.
Price to Earnings
The price to earnings ratio compares a company’s market price to its earnings per share. Analysts often compute trailing P/E using the last twelve months of earnings, or forward P/E using expected earnings for the next year. A lower P/E can indicate lower growth expectations, higher risk, or temporarily depressed margins. A higher P/E can reflect higher expected growth, stronger competitive position, or lower risk. Comparing P/E across companies is most useful within the same industry and business model. Cross-industry comparisons require caution because capital intensity, cyclicality, and accounting practices differ.
Enterprise Value Multiples
Enterprise value adds net debt and minority interests to market capitalization and subtracts cash and cash equivalents. EV-based multiples such as EV to EBIT or EV to EBITDA help compare firms with different capital structures. EBIT includes the effects of depreciation and amortization while EBITDA excludes them. EV to EBIT can be more informative in capital intensive industries where asset wear and replacement matter, while EV to EBITDA is frequently used for comparability but needs context about future capital spending.
Discounted Cash Flow and Residual Income
Discounted cash flow valuation estimates intrinsic value by projecting free cash flows and discounting them to present value using a rate that reflects risk. Earnings inform the cash flow forecast through margins, tax rates, and reinvestment needs. The residual income approach starts from book equity and adds the present value of future economic profits, defined as net income minus a charge for the cost of equity. Both frameworks rely on earnings as a measure of economic performance and on the relationship between return on invested capital and the cost of capital.
Dividends, Payout, and Sustainable Growth
In the long run, earnings fund dividends and share repurchases. The sustainable growth rate can be approximated as the product of return on equity and the retention ratio, which is one minus the dividend payout ratio. This relationship links profitability and reinvestment to expected earnings growth. High growth requires either high returns on equity, high retention, or both. If returns fall toward the cost of equity, growth adds less value than it appears because each dollar reinvested generates lower incremental profit.
Why Earnings Matter for Long-Term Valuation
Earnings connect operations to value in three ways. First, they summarize the current economics of the business by embedding prices, costs, and scale. Second, they signal the firm’s ability to reinvest cash at acceptable returns, which drives future growth. Third, they provide a common metric for comparing firms within an industry under a consistent accounting framework.
Because business conditions change, analysts consider both the level and the durability of earnings. Industry structure, competitive dynamics, and cost position affect how resilient margins will be. Over long horizons, extreme profitability often faces competitive pressure as rivals enter or technology shifts. Evaluating earnings means assessing whether the drivers of profit are defensible and repeatable rather than assuming recent results will persist.
Real-World Context: How Markets React to Earnings
Public companies report earnings quarterly in many jurisdictions. Financial news tracks earnings season, consensus estimates, and the size of positive or negative surprises. A reported figure that exceeds expectations can move prices as investors update beliefs about future profitability. Conversely, a miss or a change in guidance can adjust expectations and valuation multiples. These reactions illustrate how earnings play a central role in the information flow that influences prices.
Consider a hypothetical consumer electronics company that reports strong revenue growth but lower operating margin due to higher component costs. Net income rises modestly while free cash flow declines because inventory builds ahead of a product launch. The market may interpret the result in several ways. Some observers might focus on the revenue momentum, while others might question margin sustainability and cash conversion. The earnings print is a starting point for analysis, not a final judgment. It prompts questions about cost trends, pricing power, and working capital management.
Interpreting Earnings Across Industries
Comparing earnings across industries requires attention to economic and accounting context:
- Cyclical manufacturers: Earnings fluctuate with demand for big-ticket goods. Analysts often examine multi-year average margins and normalized earnings to avoid reading too much into a single peak or trough year.
- Software and subscription services: High gross margins and recurring revenue are common. Revenue deferrals and stock-based compensation can create sizable differences between GAAP earnings and cash flow. Lifetime value and customer acquisition costs sit in the background of any earnings discussion.
- Banks and insurers: Earnings depend on net interest margins, credit losses, underwriting results, and regulation. Because leverage is a core part of the model, capital adequacy and risk provisioning are central to evaluating the quality of earnings.
- Utilities and infrastructure: Earnings are shaped by regulated returns on invested capital. Depreciation and allowed rate bases have a larger role than in many competitive industries.
These differences underscore why a single metric cannot capture performance across diverse business models. Earnings remain a common denominator, but interpretation must be tailored to industry economics.
Practical Illustrations
Example 1: A Cyclical Industrial
Suppose a heavy equipment manufacturer reported net income of 1.2 billion last year during a demand upswing. Five years of history show net income ranging from a small loss at the trough to 1.3 billion at the peak. A simple trailing P/E may make the stock appear inexpensive at the peak because earnings are temporarily high. An analyst who normalizes earnings over a cycle might instead focus on average operating margins and mid-cycle volumes to estimate a sustainable earnings level. The normalized figure can then feed a valuation model that does not depend on a single strong year.
Example 2: A Software Platform
Consider a subscription software company with rapid revenue growth and significant stock-based compensation. GAAP net income is near breakeven due to high research and development and sales expense, while operating cash flow is positive because non-cash compensation and deferred revenue add back to cash from operations. The firm’s adjusted earnings exclude stock-based compensation and some one-time integration costs from an acquisition. An analyst weighs whether stock-based compensation is a recurring cost of attracting talent and whether excluding it overstates underlying profitability. Understanding the conversion of earnings into cash and the sustainability of growth is crucial in this case.
Example 3: Share Repurchases and EPS
A consumer staples company buys back shares, reducing the share count by 5 percent. Net income is flat year over year, but diluted EPS rises due to fewer shares outstanding. The improvement in EPS reflects changes in ownership structure rather than higher total earnings. Analysts often examine both total earnings and per-share metrics, along with the value received for buybacks relative to intrinsic worth, to avoid conflating financial engineering with operational progress.
Analytical Steps When Reviewing Earnings
A structured approach helps make sense of reported numbers:
- Read the income statement with an eye to what changed in revenue, gross margin, and operating margin. Determine whether unusual items affected the period.
- Examine the reconciliation from net income to operating cash flow. Identify whether working capital, non-cash charges, or timing effects explain differences.
- Assess capital intensity by comparing depreciation to capital expenditures and consider maintenance versus growth investment needs.
- Review notes and management’s discussion for policy changes, major contracts, and risks that affect future earnings.
- Cross-check profitability with returns on invested capital and equity to link earnings to the efficiency of capital use.
International and Currency Considerations
Global companies report earnings in a functional currency. When operations span multiple currencies, translation effects can raise or lower reported revenue and earnings independent of underlying demand. Analysts sometimes look at constant-currency growth to isolate operating trends. Accounting frameworks differ in some areas between GAAP and IFRS, including treatment of development costs, impairment triggers, and lease capitalization periods. These differences can influence reported earnings and comparability. Awareness of the framework and the company’s policy choices is important when comparing peers across jurisdictions.
Common Adjustments and Normalization
Analysts frequently make adjustments to derive a view of sustainable earnings:
- Normalize tax rates: Replace a one-time low or high effective tax rate with an estimated long-run rate.
- Remove clearly non-recurring items: Exclude unusual gains or charges that are not expected to repeat, based on judgment and disclosure.
- Revisit stock-based compensation: Decide whether to include it in adjusted operating metrics given its recurring nature and dilutive effect.
- Lease and pension adjustments: Consider the economic impact of leases and pension obligations if they materially affect operating costs or leverage.
- Cycle normalization: For cyclical businesses, use multi-year averages or mid-cycle assumptions to avoid extrapolating extremes.
Normalization is not a mechanical exercise. It requires understanding what is typical for the business model and where the current period sits relative to a cycle.
Using Earnings in Relative Comparison
Across a peer group, earnings-based multiples can help position a company’s valuation. Within an industry, differences in margin structure, growth expectations, and capital intensity explain spread in P/E or EV to EBIT multiples. Comparing multiples without understanding the economics often leads to misleading conclusions. Higher multiples can be rational if earnings are more resilient, growth is more durable, or risk is lower. Lower multiples can reflect structural disadvantages or cyclical exposure.
Limits of Earnings as a Valuation Anchor
Earnings are informative but not sufficient on their own. Four limits are common:
- Accounting discretion: Reasonable choices and estimates can shift results across periods without changing long-run economics.
- Cyclicality and shocks: External factors such as commodity prices or regulation can rapidly change profitability.
- Capital structure effects: Interest expense and leverage alter net income independently of operating performance.
- Mismatch with cash: Positive earnings and weak cash flow can occur for extended periods in growth phases, which affects valuation if reinvestment needs are high.
A balanced approach uses earnings alongside cash flow, assets, and competitive analysis to form a view of intrinsic value.
Conclusion
Corporate earnings summarize how effectively a company transformed revenue into profit over a period. They sit at the center of fundamental analysis because they bridge operating results, capital allocation, and valuation. Reported earnings are shaped by accounting rules and managerial choices, so interpreting them requires attention to quality, sustainability, and the connection to cash flow. Within valuation frameworks such as P/E comparison, enterprise value multiples, discounted cash flow, and residual income, earnings provide the quantitative basis for judging whether a price is justified by the economics of the business. The careful analyst treats earnings as a starting point, investigates the drivers behind the numbers, and evaluates how durable those drivers appear over time.
Key Takeaways
- Corporate earnings, typically measured as net income, are a period’s profit after all expenses and are central to fundamental analysis.
- Accrual accounting, non-cash items, and managerial estimates shape reported earnings, which makes quality assessment essential.
- Earnings inform intrinsic valuation through P/E ratios, enterprise value multiples, discounted cash flow, and residual income models.
- Normalized and industry-aware interpretation helps distinguish temporary effects from sustainable earnings power.
- Earnings should be evaluated alongside cash flow, capital intensity, and competitive dynamics to understand long-term value.